

This is the last piece in the series, and it answers the question that started it: what would ever make a truly great company fall to a price a value investor could pay. Six weeks of chasing that question led me somewhere I did not expect, into the strangest set of economic data I have seen in years, and to a conclusion that does not scare me. It excites me. But to see why the data points where I think it does, you first have to know what kind of investor is reading it, because that is what sent me looking in the first place.
The Long View · The reckoning at the end of the series · Evidence, not prediction
The Long View makes no forecast here and names no target. This is a reading of public data and an honest conclusion. Verify everything and decide for yourself.
Where this started
A few weeks ago I graded Nebius, an AI company growing more than four hundred percent a year, one of the most impressive businesses I had ever scored. And I could not buy a share, because the price demanded everything go right forever. A wonderful company at a terrifying price.
That left me one question I could not put down: what would ever make a company this good come back to a price a value investor could pay? I meant it about one stock. It became this series, because the answer kept pulling me further out, to the bond market, the national debt, the consumer, and finally the machinery of the whole economy. This is where that road ends.
But before I show you where it leads, you should know what kind of investor is doing the looking, because it is the reason I went looking at all. I am a value investor, and if I am honest, I am a value everything. I bought a large Herschel suitcase at Dillard’s last weekend, 325 dollars on the tag, and I paid 113 for it, sixty-five percent off. The discount made me happier than the luggage. I am not cheap. I just cannot stand overpaying for something I know the real worth of, whether it is a suitcase or a business.
That instinct is not a hobby. It is the entire method, and it is what makes a piece like this matter, because a value investor spends most of a career waiting, and only acts when fear puts a great business on sale. I know it works, because I have done it.
When the world was terrified in 2020, I was buying.
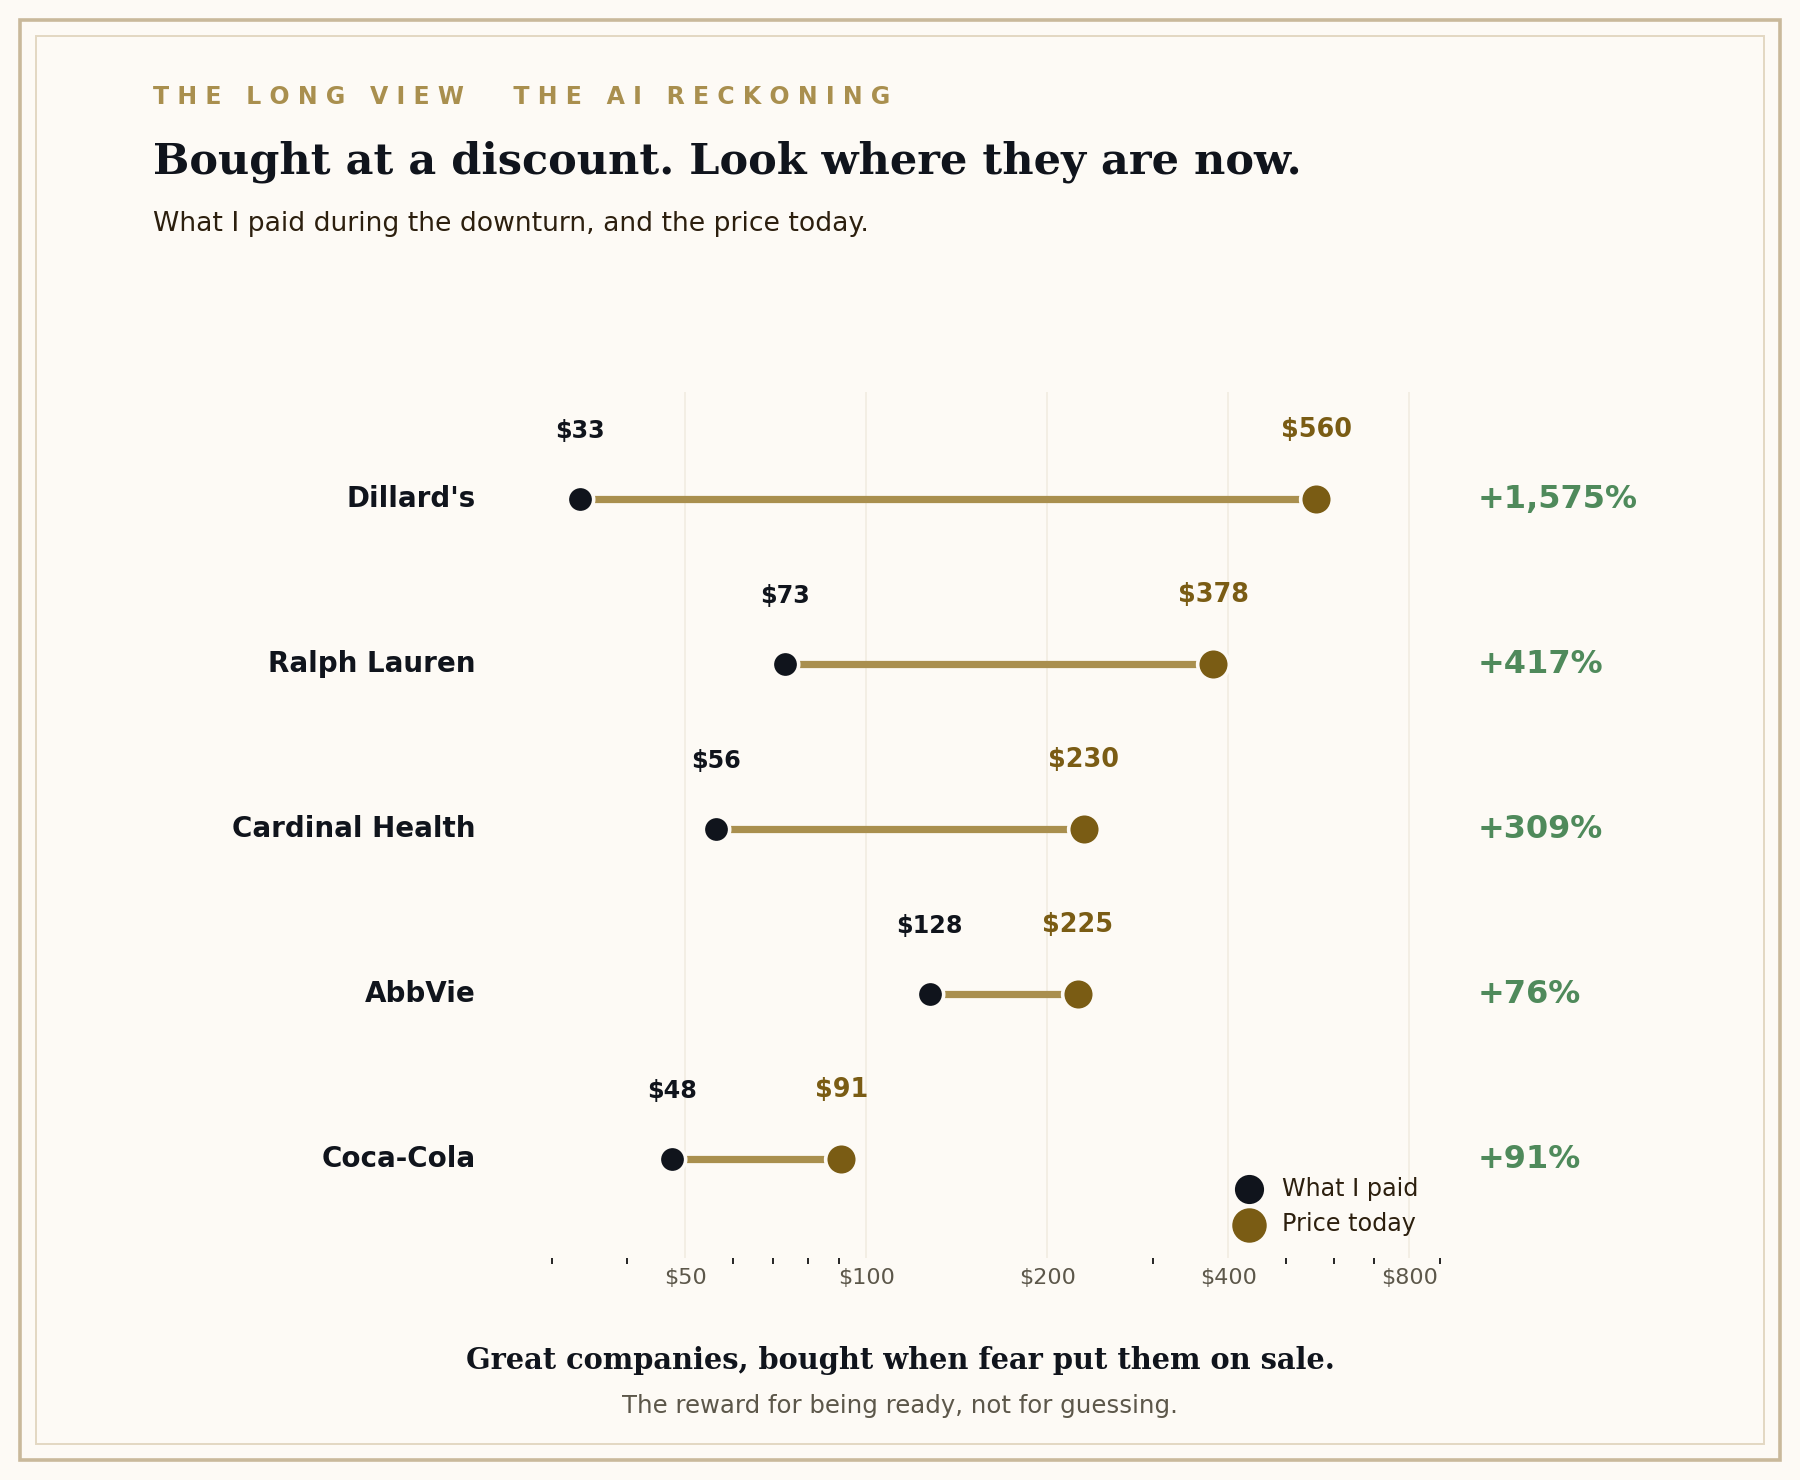
My average cost on Dillard’s is about 33 dollars, and it trades near 560 today. Ralph Lauren, an average near 73, now around 378. Cardinal Health, around 56, past 230. Coca-Cola near 48 and AbbVie in the 120s, both since more than doubled.
I have shopped at Dillard’s for years and bought more Ralph Lauren there at deep discounts than I care to admit, so when both went on sale in 2020, I was not reading a screener. I was buying businesses I already knew as a customer.
But let me be clear about what that pattern is not. I did not predict COVID. I did not forecast the crash. I simply had cash set aside and a short list of businesses I understood, so that when the moment came, I was ready to act while others were frozen. Not predicting the storm, but being prepared for it. That is the entire edge, and it is what this series is built around.
Underneath all of it ran the most boring habit in investing: dollar-cost averaging into my index funds, the same amount every month, through the fear and long after. My average cost in the Vanguard technology index sits near 47, and it trades around 120 today. I timed none of it. I just never stopped. A down market is the best time to lean into that too, more shares at lower prices, which matters most if you are building toward a goal or nearing retirement.
So that is the lens. And here is why I am telling you now, at the start. In 2020 I was ready by temperament and system alone, no dashboard of warning lights, just cash and a discipline. This time I have that same preparation, plus something I did not have then: the instruments are already flashing. The data does not make me a value investor, my system does that.
But a set of readings this abnormal is a gift on top of it, a signal the environment may be turning my way sooner than usual. That is what sent me down this road, and it is where the rest of this piece goes.
The point where the data started to concern me
I have no interest in alarm, so let me do the opposite. I will name every number and its source, so you can check me, and let the weight speak for itself.
Start with the consumer, because in this country the consumer is not one part of the economy, the consumer is the economy. Household spending drives roughly two-thirds of it. When the people who do that spending start to strain, that is not a side story. It is the main one.
And the strain is not my opinion. The Federal Reserve Bank of New York’s Household Debt and Credit report puts total household debt at a record 18.8 trillion dollars. In its early-2026 data, the New York Fed recorded the highest auto-loan delinquency it has ever measured, credit-card delinquency near the levels last seen at the peak of the 2008 crisis, and student-loan delinquency at its worst since before the pandemic pause.
By the New York Fed’s own figures, serious credit-card delinquency sits at 7.1 percent, up from 5.3 percent before the pandemic, and auto-loan delinquency at 3.0 percent, up from 2.4 percent.
Now the honest complication, and it may be the most important number here. On the surface, the aggregate looks fine. Bloomberg reported that overall thirty-day delinquency improved to 4.7 percent in mid-2026, and a fair reader would ask how I square that with everything above.
The average is hiding the distribution, and the Federal Reserve says so itself. A New York Fed economist noted that mortgage deterioration is concentrated in lower-income areas and areas with declining home prices. A Fed presentation this spring put it plainly: overall performance remains strong, but delinquencies are rising fastest in lower-income areas and regions with weakening labor markets.
A consumer-finance analyst at LendingTree, quoted by CNN on the same report, described it best, that a lot of people are doing just fine and spending because they feel secure, but an awful lot of people are really struggling. That split is the whole point.
And I would go one step further, from what I see with my own eyes. Even some of the people who look fine are running on borrowed money, good credit scores and open cards holding up spending that paychecks no longer cover. Borrowed money spends exactly like cash, right up until the moment it does not. So when I hear that the comfortable half is still spending, I do not find it as reassuring as it sounds. Some of that comfort is financed, and financed comfort is not the same as strength.
Set that beside the government’s balance sheet. Interest on the national debt now costs more than the entire military budget, and the deficit is running near two trillion dollars a year with unemployment near four percent, borrowing at a pace usually reserved for recessions during what are supposed to be the good times.
Any one of these readings you could explain away. Together, from sources as sober as the Federal Reserve and the Congressional Budget Office, they describe a system running hot with a large part of its population falling behind. That is not what a healthy expansion looks like. It is a system with far less margin for error than the headline numbers admit.
The comfortable majority is masking a struggling minority, and the struggling minority is the high-spending working class an economy like ours runs on.
The number that explained the rest
For a while I had the symptoms without the mechanism. Then I found the number that ties them together, from the least dramatic source imaginable, a Federal Reserve data series.
It is called the velocity of money: how fast a dollar moves through the economy, how many times it changes hands. A dollar that reaches someone who spends it becomes someone else’s income, which becomes their spending, and around it goes. That circulation is what an economy really is. And it has been slowing for a quarter century. By the Federal Reserve’s own data, the velocity of the M2 money supply has fallen by roughly a third since its late-1990s peak, to near the lowest on record.
Money that pools instead of circulating is a slowing economy, written as a single number.
The Federal Reserve’s own research explains why, in language far drier than the implication. A 2025 Fed study found that the wealth gains of recent years flowed disproportionately to higher-income households, whose propensity to consume is lower, and concluded that the rise in wealth did not translate into the same level of consumption it would have if it had been more evenly distributed.
Put that next to Bureau of Labor Statistics and Congressional Research Service data showing that since 1979 productivity has risen far faster than wages, and you have the mechanism behind every symptom above. The money is not reaching the people who spend it. The circulation that drives a consumer economy is quietly stalling.
The loop that looks like growth
Here is where it connects to AI, and where I had to be careful, because this part is easy to overstate.
The AI build is real, and much of its growth is real, paid for by real customers. Hold onto that. But watch how the money moves inside it.
By industry estimates compiled from company guidance, the largest technology companies are on track to spend near eight hundred billion dollars on AI infrastructure this year, more than the entire output of Switzerland, and most of it flows to a very small set of recipients.
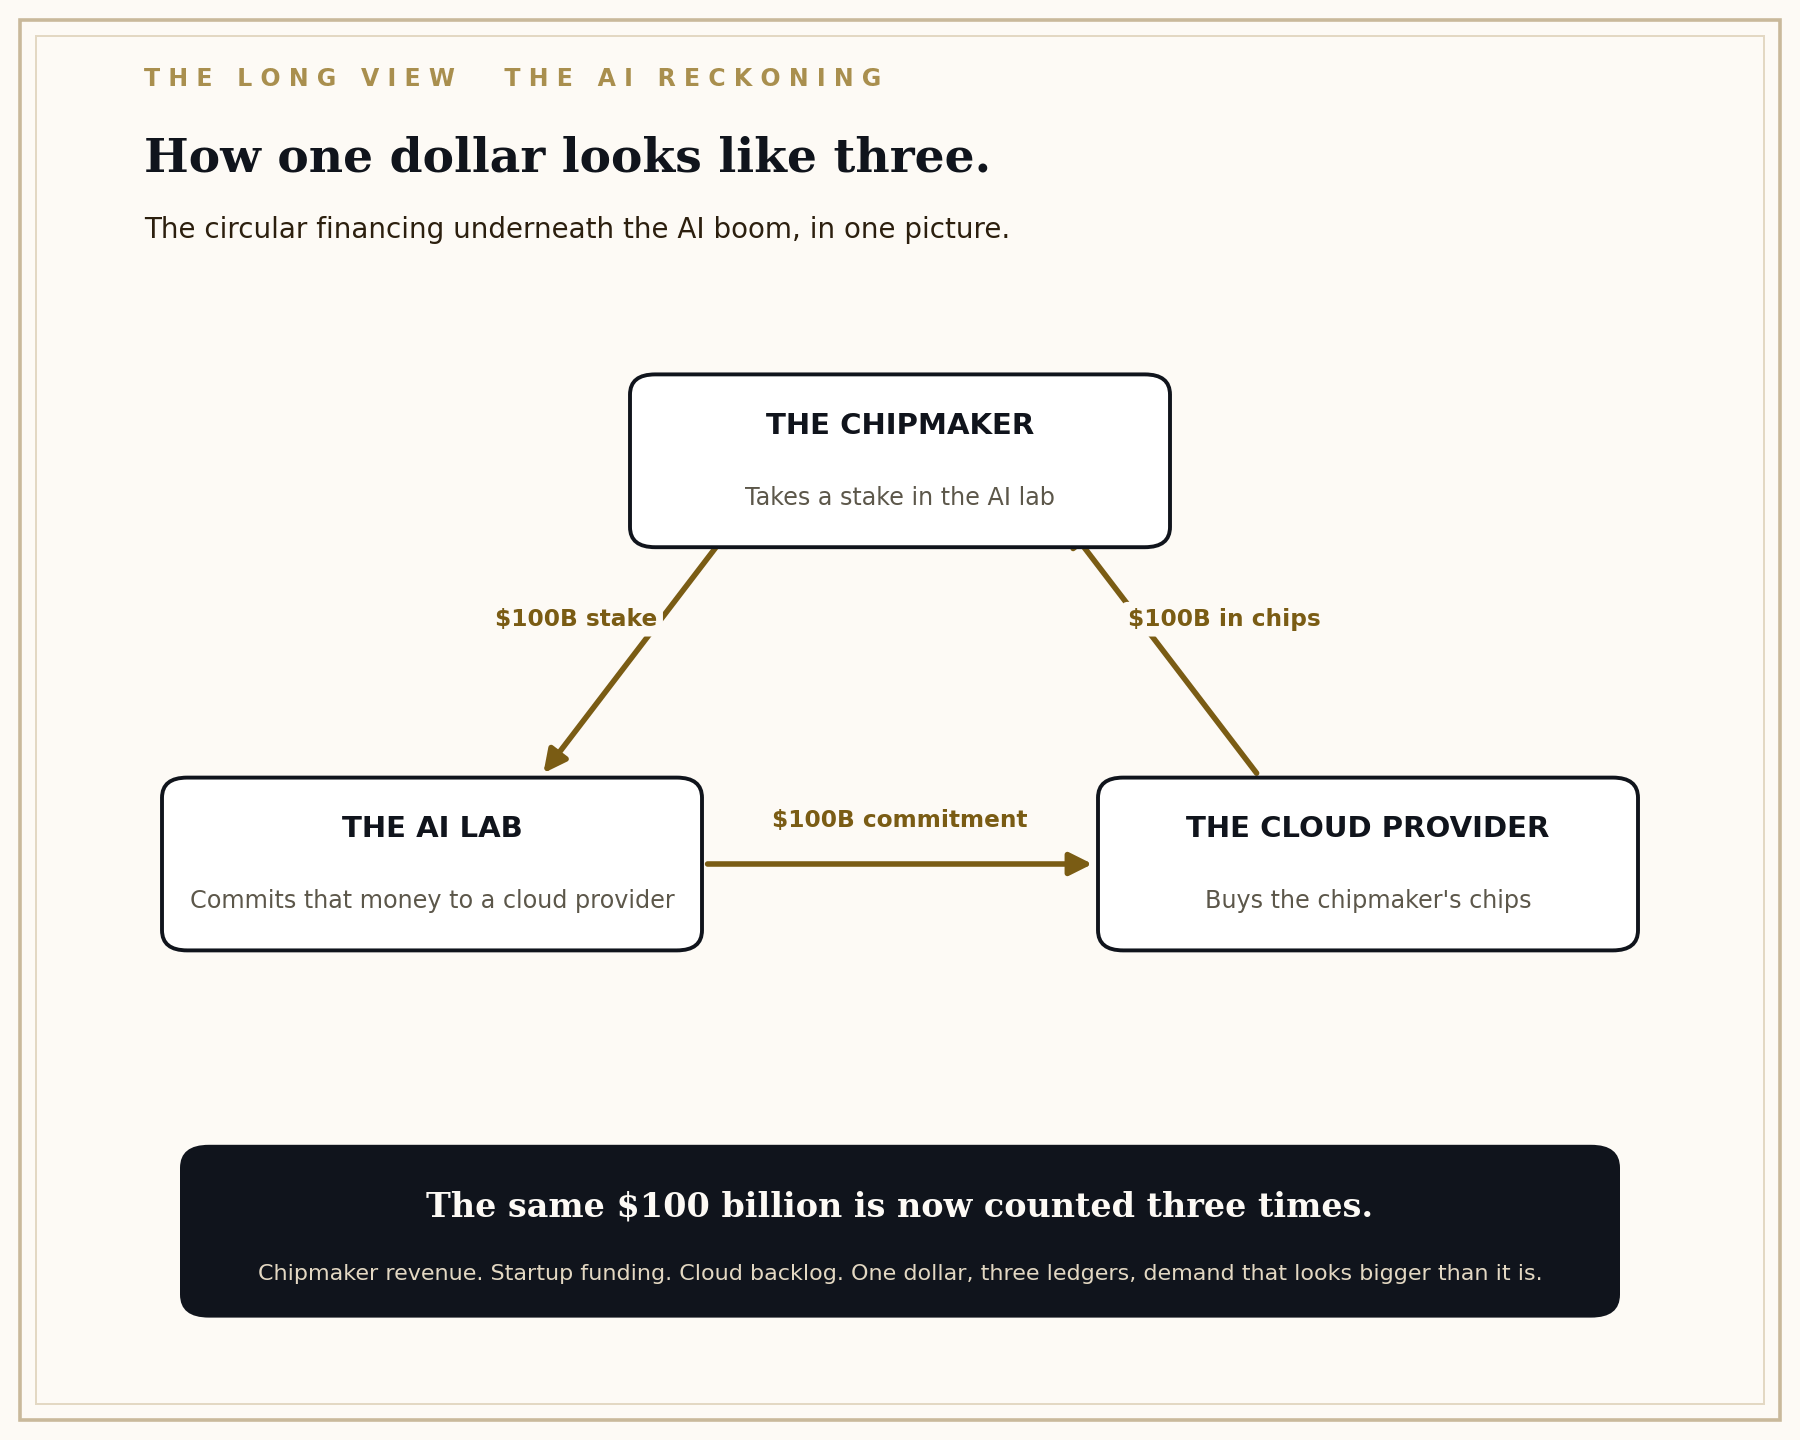
And those companies are entangled. A chipmaker takes a stake in an AI lab, the lab commits to a cloud provider, the provider buys the chipmaker’s chips. Analysts measure these arrangements in the hundreds of billions, and the problem is plain: the same dollar can show up as a chipmaker’s revenue, a startup’s funding, and a cloud’s backlog at once, making end demand look larger and more independent than it is.
Set the two side by side. Inside the AI loop, capital moves at tremendous speed and scale, but among a handful of companies, much of it debt-financed, some flowing in a circle. Outside that loop, the circulation that reaches ordinary consumers has been slowing for twenty-five years.
The growth everyone is counting on to carry the debt and justify the valuations is running hot inside a sealed circuit that never reaches the consumer the story depends on. That is not a prediction. It is how the money is moving right now, and it is not normal.
The cushion that softened past blows is thinner now
There is one more piece most market commentary leaves out. When the consumer has buckled before, the government has stepped in to soften the blow, and that rescue does something people forget: it flows downstream into company revenue and asset prices, including the technology names at the center of this boom.
COVID is the vivid example. The Tax Policy Center puts the total federal response near 5.6 trillion dollars, and the Congressional Budget Office estimated it lifted real GDP by nearly five percent in 2020. That money did not stop at the kitchen table. It became consumer spending, then corporate revenue, then support under stock prices across the market, tech and AI included. When Washington cushions the consumer, it quietly holds up the whole market at the same time.
But the cushion is thinner this time. That same COVID response drove federal debt from about 79 percent of GDP in 2019 to 97 percent by 2022, on the Tax Policy Center’s figures, and we are above that now with the interest bill already exceeding the military. A government can only run the same play so many times before the play becomes the problem.
This is not a prediction that help would not come. It is a plain observation that there is less room to provide it without deepening the very debt at the root of the story, which means the margin for error is thinner precisely where we have leaned on it hardest before.
What the data is telling me, and why I will not ignore it
I spent a career in analytics, so let me be clear about what I am and am not doing. I am not predicting. Predicting means naming the event and the date, and no one can truly do that. But reading data and reaching a conclusion you act on is a different thing entirely, and it is the whole point of the discipline.
Think about 2008. The data told the story well before the break. The housing leverage, the subprime deterioration, the tangle of derivatives on top, it was all visible, and the people who read it carefully knew the structure would fail if the conditions held. Not one of them called the exact day. That was never the point. The data was reliable, the picture was past any single worrying number, and the honest response was to prepare rather than look away. The ones who got ready were not lucky when it came. They were positioned.
That is where I am now, and I will say it plainly because Monday I promised you an honest answer rather than a shrug. When this many independent instruments read abnormal at once, the deficit at full employment, the delinquencies past their 2008 marks, the savings rate on the floor, the housing split, velocity stalling, and a partly circular loop dressed up as organic growth, the data has crossed from a collection of curiosities into a coherent story.
And the story is that the system has unusually little margin for error. I cannot tell you when that matters. I can tell you that the math is the math, and that the readings are real.
What history does, and does not, tell us
This series has leaned on history the whole way, the debt we grew out of after the war, the inflation of the nineteen-forties, the dot-com wiring of 1999. So let me end the historical thread where it naturally points, and let me be disciplined about what it can and cannot say.
History does not tell you when. It tells you what the setup looked like the last few times, so you can recognize it. And the setup before the three great crashes of the modern era, 1929, 2000, and 2008, is unusually consistent. Two things were present each time: leverage growing faster than the real economy, and value concentrated in a small handful of names.
In 1929 it was a cluster of glamour stocks. In 2000 the top technology names. In 2008 concentrated exposures in the banks. Different decade, same shape.
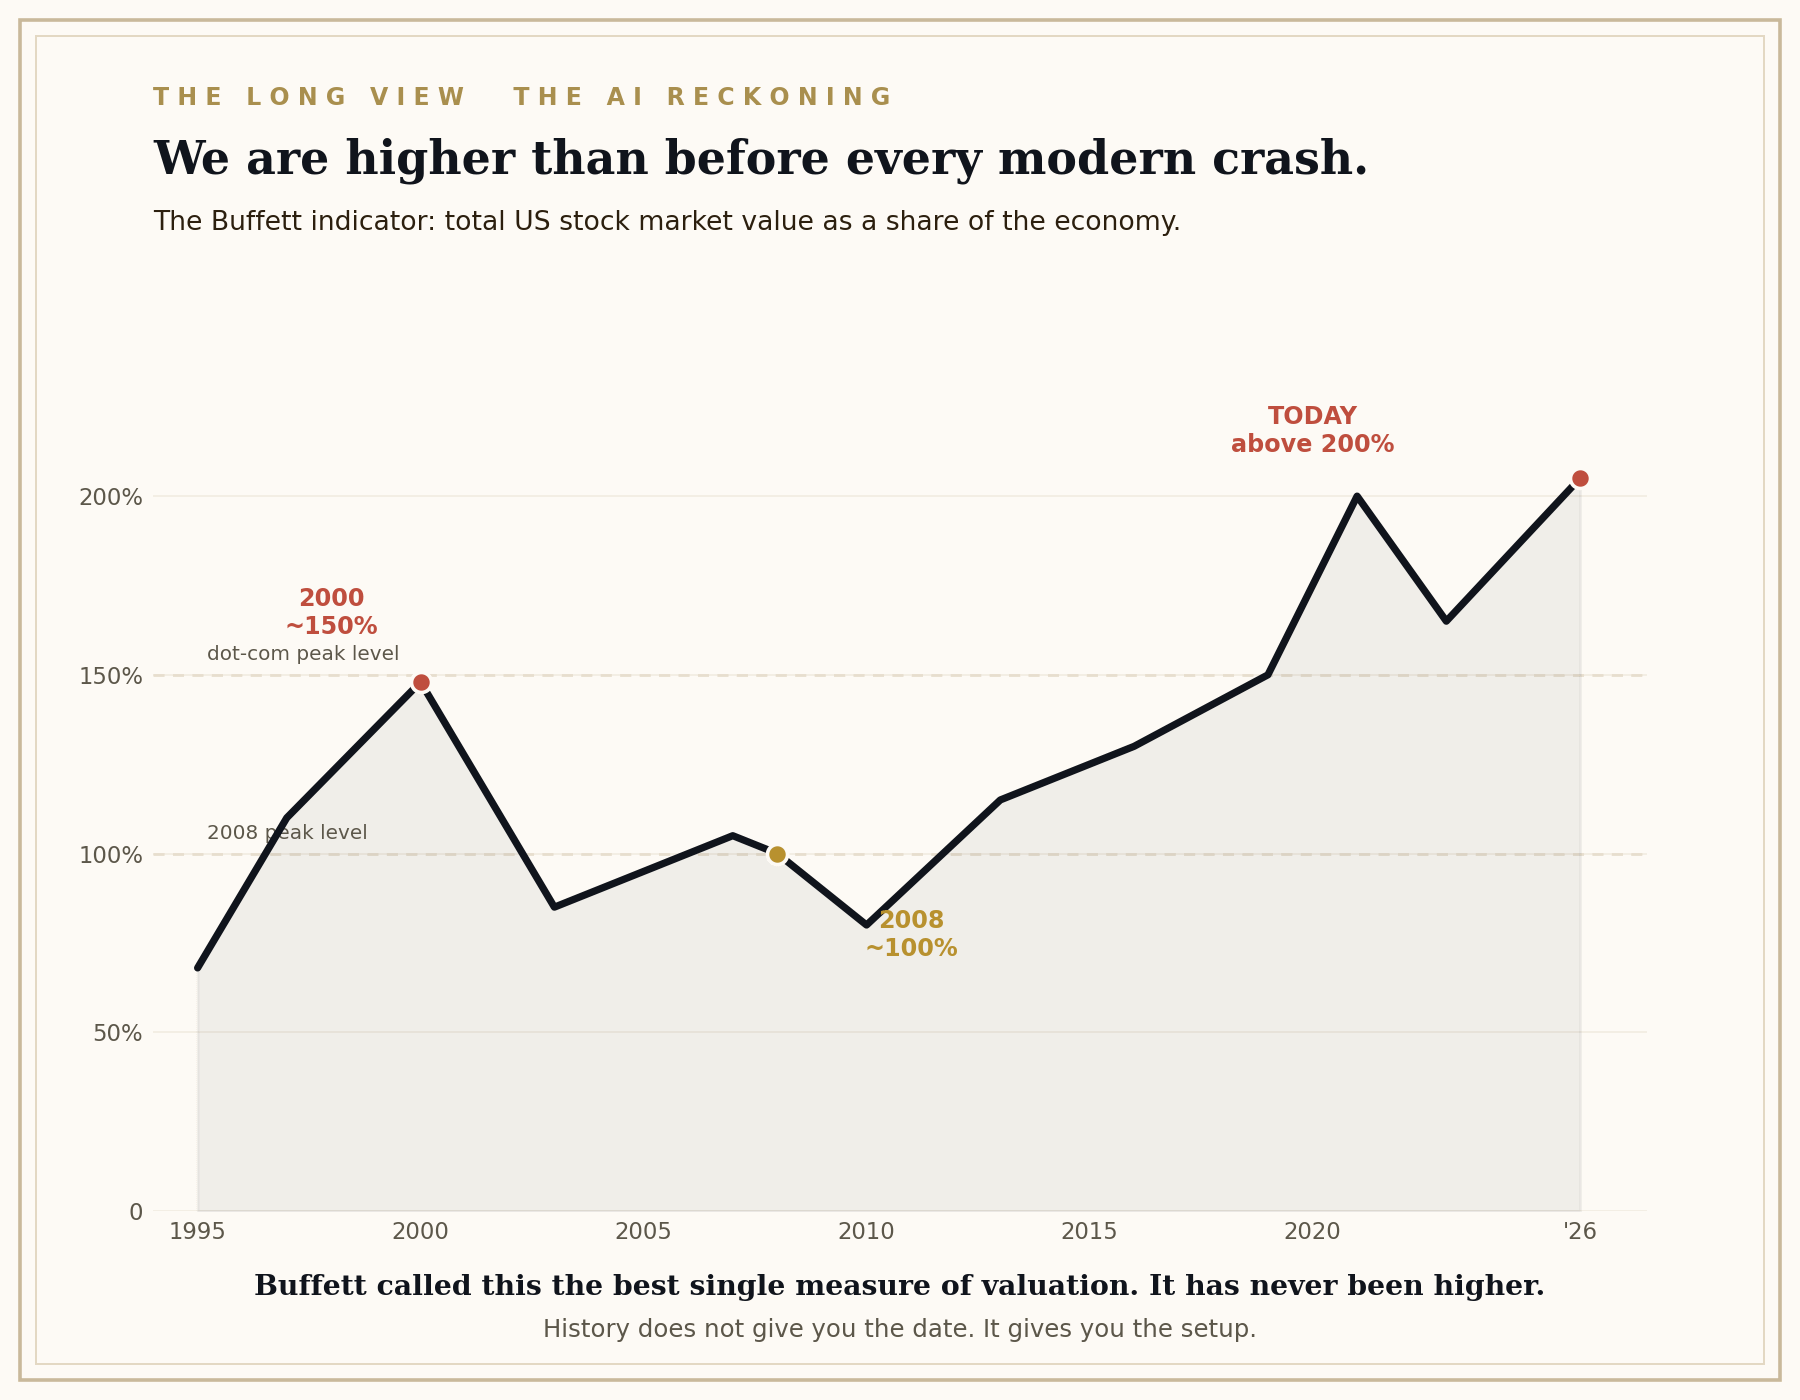
Now the readings today, by the same yardsticks. Household debt sits at a record, above the level that preceded 2008. The Buffett indicator, the ratio of the market’s value to the size of the economy, which Buffett himself called the best single measure of valuation, ran near 150 percent before the dot-com crash and above 100 percent before 2008. Today it is above 200 percent.
And the concentration of the market in a few AI names is as extreme as any of those earlier episodes. By the measures history hands us, the readings are not merely elevated. They are past where they stood before the events we all remember.
I am not telling you that means a crash, and I want to be precise about why. The honest truth about a bubble is that you cannot confirm it was one until it pops. History gives you the pattern, not the date, and that pattern can persist far longer than anyone expects, or ease off without breaking at all.
So take the information for exactly what it is. Here is what the data looked like before, here is what it looks like now, and here is the plain fact that the two look a great deal alike. Do with that what you will. The only response I cannot defend is pretending the resemblance is not there.
Which is really the whole argument for preparing rather than predicting. If you get ready and the strain resolves quietly, you have lost very little, some patience, a bit of yield on cash. If you get ready and it does not resolve quietly, you are one of the few people positioned instead of trapped. Prepared, you are safe either way. Head in the sand, you are only safe in one.
Prepared, you are safe either way. Head in the sand, you are only safe in one.
Why this makes me more interested, not less
If I stopped there, you would close this piece uneasy. That is not where the data leaves me. Working through all of it, I went from concerned to energized about it.
Here is why. Everything I have just described is the exact condition under which great companies finally go on sale. The best businesses do not become affordable because they get worse. They become affordable when the environment cracks, when a stretched system wobbles and prices reset all at once, the strong dragged down with the weak.
The very fragility that unsettles everyone is the thing a patient investor waits years for. The old wisdom, and Warren Buffett has built a career on the idea, is to be cautious when everyone else is greedy and bold when everyone else is afraid. Fear is not the thing to run from. For someone who has done the work, it is the thing to be ready for.
Return to the question that started all of this. What would have to happen for a company like Nebius to come back to a price a value investor could pay? For most of this series I could only gesture at the answer. Now I can say it plainly. What would make these great companies cheap is precisely the moment the market stops assuming all of their growth is real, durable, and independent, and reckons with the part that is circular and borrowed.
That reckoning does not require any company to fail. It only requires the story to be seen clearly. And when it comes, the price of even the best of them could fall to a level that finally offers a margin of safety.
Cheap and crisis tend to arrive together. That is not a reason to fear the crisis. It is a reason to be ready for the cheap.
So, is any of this sustainable
Let me answer the question in the honest two parts it deserves, because they are not the same question.
Is the technology real and durable? Yes. AI does real work, earns real revenue, and is being woven into the economy for good. I would not bet a dollar against it as a technology.
Is the current form sustainable, the valuations priced for perfection, the growth financed with debt and flattered by circular arrangements, resting on a consumer whose circulation is stalling? Not like this, not forever. But unsustainable is not the same as collapse, and anyone who claims to know the timing is guessing or selling something. Unsustainable describes fragility, not a schedule. The right response is not to predict the day it breaks. It is to refuse to pay a price that requires it never to.
Where that leaves us
So here is where the series lands. I am not predicting a crash. I am reading a set of instruments that, together, are more abnormal than any I have seen in years, and positioning for what such readings have historically preceded, without pretending to know when.
That means holding cash, not out of fear but as a loaded position, paid a real return to wait. It means doing the research now, in the calm, so I know exactly what each business I want is worth before any storm arrives. And it means the discipline to do nothing until a price offers a real margin of safety, then the resolve to act when everyone around me is too frightened to.
That is the whole series in one sentence. The environment is showing more strain than it has in a generation, and for the investor who has done the work and kept the powder dry, that strain is not the thing to fear. It is the opportunity of the cycle, arriving in the disguise it always wears.
So here is what comes next, and it is where this series becomes the beginning of something rather than an ending. I am always hunting for new great companies, the kind that clear the firewall and earn a place in a portfolio for years. That hunt never stops, and the supplier layer we spent this week on is full of candidates.
But here is the part people forget: some of the old names I already own are still great, and a downturn does not make them worse. It makes them better, because it lets me buy more of a proven winner at a lower price.
I would love nothing more than to lower my average on the companies I already believe in. I bought Dillard’s, Ralph Lauren, and Cardinal Health when the world was scared, and I am not done with any of them. A real dislocation would be a gift, a chance to add to the businesses I know cold, at prices only fear can produce. That is why I am not afraid of what the data shows. I am ready for it.
So the next phase of The Long View starts now. I am building the list, the new names worth owning and the old ones worth owning more of, and I am putting a price on each, the number that would finally make it a buy. When the environment gives us that number, I do not want to be forming an opinion in the panic. I want to be acting on one I made in the calm.
I started this series unable to buy a company I admired. I am ending it with a growing list of companies I admire, a price I would pay for each, and the patience and the cash to wait. That is not a gloomy place to end. For a value investor, it may be the best place to stand.
Run any company through the Stock Story Firewall, free, at firewall.readthelongview.com. Subscribers get the Watch cards, the Evidence tool, and the full Research Tracker. Thank you for reading this series. The comments are open, and this is where it gets good.
Not investment advice. The subscriber decides.
Extreme valuations can persist much longer than expected, but they also create an important asymmetry. The key is identifying what could actually bring valuations back toward historical norms, rather than simply assuming mean reversion.