

Between the end of 2025 and their latest reports, Meta (Nasdaq: META), Alphabet (Nasdaq: GOOGL) and Amazon (Nasdaq: AMZN) added about $137 billion of long-term debt between them. All three are spending heavily on AI data centers. Microsoft (Nasdaq: MSFT) is spending on the same scale, and its debt barely moved. Between 27 and 29 October, three of the four report again, along with two companies that make parts for data centers. By Friday 30 October you will know who is paying for the AI build, and you will be able to check it yourself with three readings.
Disclosure: the author holds none of the companies named here.
Why this matters if you own any AI stock
Many AI stocks depend on the same thing: a handful of very large companies spending money on data centers.
That spending is someone else’s income. When Meta or Amazon buys servers, cables, cooling and power equipment, the companies that make those things get paid. Chip makers, fiber makers, parts makers and power companies all sit downstream of that money.
So the question is simple. Where is the money for the build coming from? If it comes out of what these companies earn, the build can keep going as long as their businesses do well. If more of it comes from borrowing, the build starts to depend on lenders too.
In mid-October, lenders showed how they treat a smaller AI company that borrows heavily to build. They charged CoreWeave far more to carry its debt, and its shares lost a quarter of their value in five trading days. This piece is about the giants.
Four terms anyone can read
Each of the four builders publishes the figures behind these terms every three months. Here is what each one means, in dollars.
Capital spending is money spent on buildings and equipment that will be used for years. A data center is capital spending.
Cash from the business, which companies call operating cash flow, is the cash that came in from running the business during the quarter, after paying staff, suppliers and taxes.
Cash after spending is the first number taken away from the second. If a company brings in $40 billion of cash and spends $45 billion building, its cash after spending is negative $5 billion. It had to cover that $5 billion from savings or by borrowing.
Long-term debt is money the company owes that is not due within the next year. Debt due within the year is listed separately, and the two together are total debt. If debt goes up, the company usually borrowed more than it paid back.
Those four terms are all you need through Friday 30 October.
What the four latest reports show
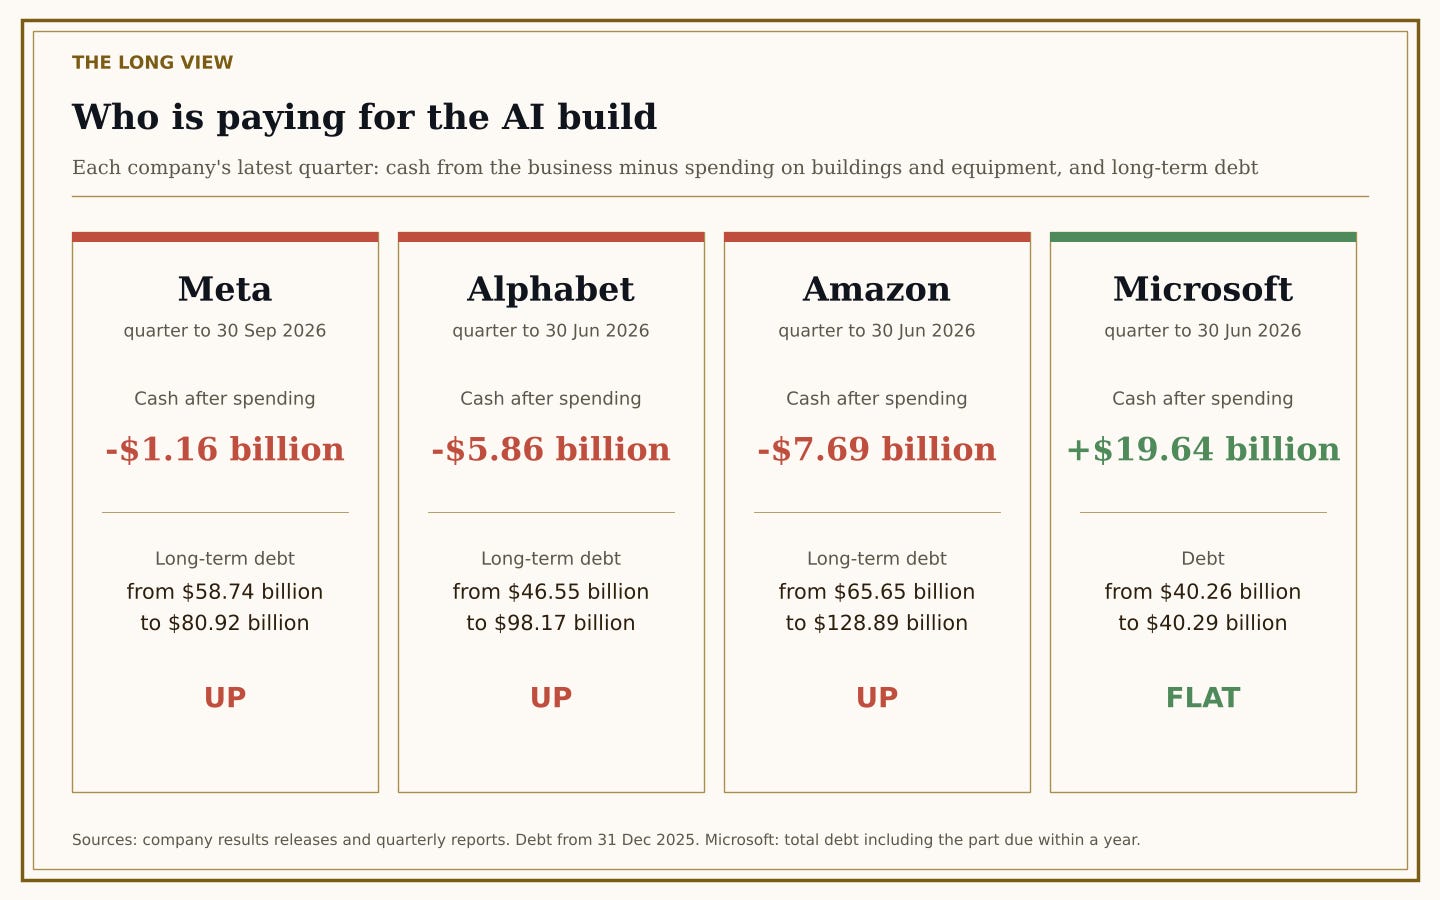
Each figure below comes from the company’s own latest quarterly results or quarterly report. The quarters are not the same for all four, so each one is dated.
Meta, in its quarter ended 30 September 2026: cash from the business $32.79 billion, capital spending $33.94 billion. Cash after spending: negative $1.16 billion.
Alphabet, in its quarter ended 30 June 2026: $39.07 billion in, $44.92 billion spent. Cash after spending: negative $5.86 billion.
Amazon, in its quarter ended 30 June 2026: $45.39 billion in, $53.08 billion spent after small sales of equipment. Cash after spending: negative $7.69 billion.
Microsoft, in its quarter ended 30 June 2026: $55.44 billion in, $35.80 billion spent. Cash after spending: about positive $19.64 billion.
Three of the four spent more on building than their businesses brought in.
Meta: the plan went up, the cash went the other way
Meta’s results for the quarter to 30 September 2026 show both halves of the story. It now plans to spend between $135 billion and $145 billion in 2026, counting lease payments, up from a floor of $130 billion.
By Meta’s own count, which also subtracts those lease payments, cash after spending came to minus $2.12 billion. A year earlier the same measure was plus $10.63 billion.
Its long-term debt stood at $80.92 billion on 30 September, against $58.74 billion when 2025 ended.
Meta’s shares fell 6.98 percent on 22 October, the day after the results, Yahoo Finance reported. Meta announced a 2-for-1 stock split the same day, so the report did not tie the fall to one cause, and neither will I.
Alphabet: $56.23 billion borrowed in six months
Alphabet’s cash flow statement shows it raised $56.23 billion by issuing new debt in the six months to 30 June 2026. Its long-term debt went from $46.55 billion at the end of 2025 to $98.17 billion. That is more than double.
Its spending plan went up too. On 23 July, Bloomberg News reported that Alphabet raised its 2026 forecast to between $195 billion and $205 billion. In a presentation dated 3 June, Alphabet had put it at $180 billion to $190 billion.
Alphabet reports its next quarter on 28 October.
Amazon: debt nearly doubled
Amazon’s long-term debt was $65.65 billion at the end of 2025. On 30 June 2026 it was $128.89 billion, according to its quarterly report. That is nearly twice as much.
Amazon publishes its own cash after spending as a twelve-month figure. For the twelve months to 30 June 2026, it was negative $7.60 billion. A year earlier, the same figure was positive $18.18 billion.
Amazon’s results release did not give a dollar plan for 2026 spending, so the test reads what it says in its next report on 29 October.
Microsoft: the exception, with one caution
Microsoft brought in more cash than it spent. Its total debt, counting the part due within a year, was $40.26 billion at the end of 2025 and $40.29 billion on 30 June 2026. In other words, it barely moved.
The caution: the spending figure here counts equipment a company buys. It leaves out equipment rented under long leases. Meta’s report shows those lease payments came to $964 million in its latest quarter. Microsoft’s results release gives no lease figure, so this count may flatter Microsoft, and I cannot say by how much.
Microsoft reports on 28 October, after the market closes.
The hidden assumption
The hidden assumption behind the AI build story is that the giants pay for it out of what they earn. On their latest reports, three of the four did not. They borrowed or used savings to cover the gap.
Borrowing to build is not a warning sign by itself. What changes is who carries the risk if the build does not pay off.
That is not a forecast. These are very large businesses, and a few quarters of heavy building can be paid back. What these numbers do show is that the build now rests on lenders as well as earnings, for three of the four.
The week ahead, and what each day answers
Tuesday 27 October. Corning, which makes the optical fiber used in data centers, reports its results, with a call at 8:30 a.m. Eastern. The day’s notes ask whether a supplier’s sales kept growing while some of its customers borrowed to pay for the build.
Wednesday 28 October. The second piece of the week: who gets the money. It shows how to find, in a supplier’s own reports, how much it depends on these four builders. Amphenol, which makes connectors and cables used in data centers among other products, reports the same day. The Federal Reserve announces its interest rate decision that afternoon, and Alphabet and Microsoft report after the market closes.
Thursday 29 October. Notes read Alphabet’s and Microsoft’s numbers against the test below. Amazon reports after the close.
Friday 30 October. The scorecard for all four, what it means, and the lesson.
The test, set before the results
Here is how Friday will score each builder. I am publishing it now so the results cannot choose it.
1. The spending plan: raised, held or cut, against the last plan the company gave.
2. Cash after spending for the quarter: positive or negative.
3. Debt, counting the part due within a year, against the previous quarter: up or down.
Each builder then gets one of three readings. Paid from earnings, if cash after spending is positive. Paid partly by borrowing, if it is negative and debt went up. Paid from savings, if it is negative and debt did not go up.
You can score it yourself. Most of these numbers are in each company’s results release on the day it reports. Microsoft’s release says it gives its outlook on its results call, so for Microsoft I will read the call transcript.
The question to carry through 30 October: of Alphabet, Amazon and Microsoft, which do you expect to report the biggest gap between what it spends and what its business brings in?
Not investment advice. The subscriber decides.
Putting the four builders' debt figures side by side in plain numbers makes the gap easy to follow. Which of the four looks most stretched to you?