

TL;DR: A well-constructed PayPal buyback thesis circulated widely this week. The Stock Story Firewall classified it Clear for Deeper Research — not because the math is wrong but because the hidden assumption underneath the math has two specific metrics that reveal whether it is holding or cracking. This post shows exactly what those metrics are, where to find them, and what each direction means before Q2 2026 earnings in July.
A PayPal thesis made the rounds this week. The approach was honest and unusual. Rather than modeling growth, the author modeled survival — and the math was sound.
PayPal buys back 14 percent of its shares annually at $45. At the current pace, 920 million shares become roughly 690 million by Q4 2027. Divide $6 billion in free cash flow by 690 million shares and you get $8.70 per share in FCF. Apply a 15x multiple and you get $120 plus. A 24 percent five-year IRR without modeling a single dollar of growth.
The bear case was laid out honestly. Apple Pay and Google Pay eating checkout share. Braintree spending years buying volume at near-zero margins. The core PayPal button becoming the fallback option. The thesis acknowledged that the bear needs free cash flow to collapse before the buybacks stop working.
That framing identifies the right endpoint.
The Firewall adds one layer beneath it — the specific mechanism that moves before FCF does.
What the Stock Story Firewall Found
We ran PayPal through the Stock Story Firewall. The hidden assumption the tool identified is not FCF collapse. FCF collapse is the last thing that happens. The hidden assumption is the belief that determines whether it happens at all.
The hidden assumption for PayPal:
The digital payments market stays profitable enough that PayPal does not have to re-accelerate spending on incentives, marketing, and product development to compete against Apple, Block, Stripe, and embedded finance alternatives.
That spending re-acceleration is what destroys the buyback math. And it shows up in the quarterly data before free cash flow ever moves.
Classification: Clear for Deeper Research.
The thesis has real margin of safety at $45 and specific trackable metrics. But the research does not stop at the buyback math. The hidden assumption deserves close monitoring because the competitive forces the author himself identified are exactly the forces that could trigger the re-acceleration.
Why This Matters More Than the Share Count
The original thesis frames it this way: the bear needs FCF to collapse. That has not happened. Therefore, the thesis holds. That logic is correct.
The Firewall adds one specific layer beneath it. FCF in a payments business does not collapse suddenly. It compresses slowly. Quarter by quarter. The margin squeeze starts in the line items that are one or two steps removed from free cash flow — specifically in how much PayPal has to spend to defend the relationships and volumes that generate the FCF in the first place.
By the time FCF shows the pressure, the signal has been visible in the quarterly data for two or three quarters.
The evidence for or against it lives in two specific numbers that appear in every earnings release. Neither appears in the buyback math — not because the thesis missed them, but because they are the next layer of research the Firewall prescribes.
The Two Numbers That Answer the Question
Number one: Take rate — revenue divided by total payment volume.
This is the most important number in the PayPal thesis and the least discussed in the buyback analysis. The take rate tells you whether PayPal is maintaining pricing power or conceding margin to defend volume.
If merchants and consumers are staying on the PayPal rail without needing discounts to stay, the take rate holds or improves. The hidden assumption is holding.
If the take rate is compressing quarter over quarter, PayPal is conceding margin to defend volume. The hidden assumption is weakening — before FCF moves, before the buyback math breaks, while the stock is still pricing in the survival thesis.
VERIFY: Q1 2026 earnings release — Revenue divided by total payment volume for Q1 2026 versus Q4 2025 and Q1 2025. The trend across three quarters is more important than any single quarter.
Number two: Sales and marketing as a percentage of revenue — three quarter trend.
If PayPal is spending more of each revenue dollar to defend relationships, the efficiency gains in the P&L are being spent on competitive defense rather than earned through structural improvement. The margin thesis is borrowing from the future.
This is the mechanism that eventually shows up as FCF compression. It shows up here first.
VERIFY: Q1 2026 income statement — Sales and marketing line as a percentage of total revenue. Compare to Q4 2025 and Q1 2025.
What the Evidence Says
The take rate and S&M intensity together answer whether the hidden assumption is holding.
Take rate stable plus S&M flat or declining — the buyback math works. PayPal is defending share without paying unsustainably to do it. Classification stays Clear for Deeper Research.
Take rate declining plus S&M rising — competitive pressure is forcing unsustainable spending. The hidden assumption is cracking before free cash flow reflects it. Classification moves to Watch.
The current Q1 2026 data requires verification from the earnings release before the signal is clear. That is why this is Clear for Deeper Research and not Watch. The thesis has not been disproven. But both metrics are now on the watchlist.
What to Watch at Q2 2026 Earnings — Late July
Event: Q2 2026 earnings release — late July 2026.
The two metrics to pull immediately when earnings drop:
Take rate — revenue divided by total payment volume. Third consecutive quarter of compression signals the pricing power assumption is breaking down.
Sales and marketing as a percentage of revenue. Rising alongside take rate compression confirms the mechanism. PayPal is spending more to defend share while collecting less per transaction.
If both move in the wrong direction simultaneously — that is the reclassification signal.
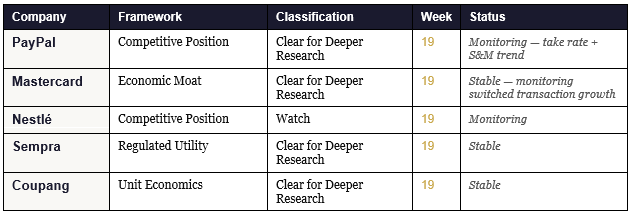
The Assumption Tracker
Companies The Long View has classified — updated weekly. Paid subscribers receive the evidence update the week a classification moves.
The Tools
Step 1 — The Stock Story Firewall
Run any company. Find the hidden assumption in two minutes. Free. No account required.
Step 2 — The Evidence Intelligence Tool
Paid subscribers bring the Firewall result here. The tool researches what the current documents say about whether the assumption is holding or cracking. Run it on any company you own or are researching.
Step 3 — The Curriculum
The curriculum teaches you to do what the tools do — permanently. Document Primers, Framework Application Guides, and the weekly evidence posts demonstrate the methodology on real companies every week.
FAQ
Why Clear for Deeper Research and not Watch on PayPal?
The hidden assumption has not been actively disproven. The take rate and S&M data require verification from the Q1 2026 earnings release before the signal is confirmed. At $45 per share there is real margin of safety in the valuation. Watch requires one of the two metrics to be actively moving in the wrong direction with data in hand. That has not been confirmed yet.
What specific number moves PayPal from Clear for Deeper Research to Watch?
Two consecutive quarters of take rate compression alongside rising S&M as a percentage of revenue. Either metric moving alone is a caution signal. Both moving simultaneously confirms the competitive pressure is forcing unsustainable spending and the buyback math is at risk.
What does the Firewall add to this thesis?
The original thesis did the hard work — honest bear case, clean math, clear risk framing. The Firewall adds one specific layer: the mechanism that shows up in the quarterly data before the endpoint arrives. Take rate compression and S&M re-acceleration are the early signals. The thesis identified what to watch for. The Firewall names where to look first.
Is this a recommendation on PayPal?
No. The Stock Story Firewall does not give price targets or buy and sell recommendations. It identifies the hidden assumption and shows whether the current evidence supports it. The author of the original thesis did real work. The Firewall adds one thing — the specific metrics that reveal whether the assumption holds before the endpoint shows up.
Why does The Long View do this every week?
Because 74 to 89 percent of retail investors lose money and the cause is always the same. They bought the story without testing the assumption underneath it. A well-constructed thesis like this one deserves more than agreement or disagreement. It deserves the one question that determines whether the math actually holds.
What has to be true for this to work?
→ Run any company through the Stock Story Firewall free: longview-firewall.netlify.app