

This is the grade where writing the bar down in advance earns its keep.
Before Nestlé reported, we ran it through the Firewall and published a Watch Card with five bars. This was the first full reporting period under its new four-category focused strategy, and the grade is against the bars we set, not a line drawn afterward to make the result look tidy.
We did not have to remember this print was coming
The Watch Card carried the date. Nestlé surfaced with all five tests pending and H1 results due July 23. The calendar lives in the tool, not in your head.
What the tool told us
The Firewall classified Nestlé Watch, framework Turnaround Analysis, and named the hidden assumption plainly: that Nestlé’s focused four-category portfolio can sustainably reignite real volume growth while expanding margins as commodity costs normalize.
Read that assumption twice, because the word that carries it is volume. A consumer-goods company can post growth two ways. It can sell more units, which is Real Internal Growth, and it compounds. Or it can charge more for the same units, which is pricing, and it runs out when shoppers trade down. The entire Nestlé turnaround rests on the first kind. Our five bars were built to tell them apart.
The bet, in one distinction
For three years, most of Nestlé’s growth came from pricing. Raise the shelf price, absorb some volume loss, report a growth number. That works until it doesn’t. The new strategy’s whole promise is that the volume comes back. So the single most important number in this report was Real Internal Growth, and we published the exact line it had to clear.
Test 1: Real Internal Growth, the number the whole thesis turns on
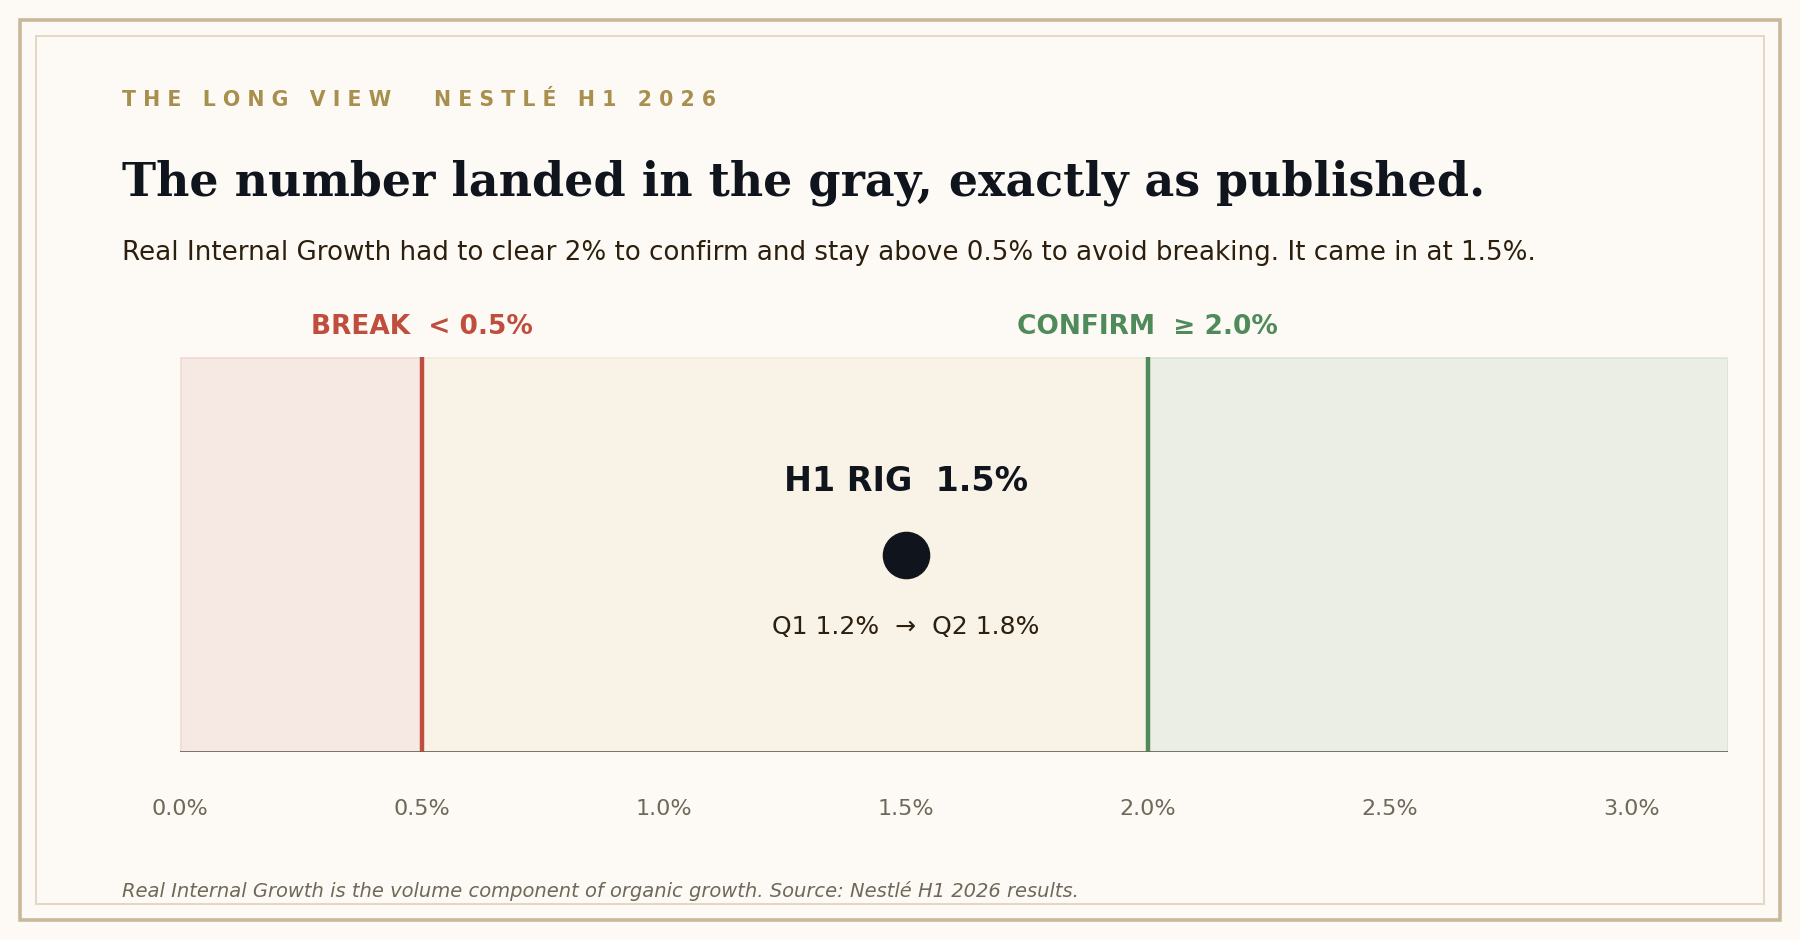
Published bar: RIG at or above 2% confirms the volume-led recovery. RIG below 0.5% breaks it as pricing-only growth.
The number: H1 Real Internal Growth was 1.5%. Split.
It is not the confirmation and it is not the failure. It sits between the two lines we drew, and the honest read is the trajectory inside it: RIG was 1.2% in the first quarter and 1.8% in the second, positive across every category by Q2. Volume is coming back. It has not yet come back at the pace that would prove the thesis. A company reporting 1.5% volume growth after three years of pricing-led numbers is turning, but it has not turned.
Test 2: Underlying operating margin
Published bar: UTOP margin above 16.5% confirms structural improvement. Below 15.8% and cost headwinds are overwhelming the savings.
The number: the underlying trading operating profit margin was 16.4%. Split, and a near miss.
Ten basis points under the confirm line. On a reported basis the margin slipped from 16.5% a year ago, and in constant currency it was flat. The pressure is real: higher coffee and cocoa prices, an infant-formula recall, and heavier advertising spend, partly offset by the cost program and pricing. Read it against the second half of last year, when margin was 15.7%, and it improved. Read it against the bar we published, and it fell just short. Both are true, which is exactly why we set a number in advance rather than a mood.
Test 3: Fuel for Growth cost savings
Published bar: H1 savings at or above CHF 0.7 billion keeps the full-year CHF 1.5 billion-plus target on track. Below CHF 0.4 billion signals the program is decelerating.
The result: this one splits on a technicality worth explaining. Incremental H1 savings were CHF 0.6 billion, below the CHF 0.7 billion half-year figure we named. But the bar had a second limb, whether the full-year target stays on track, and there the answer is unambiguous. Cumulative savings reached CHF 1.7 billion, management called the half slightly ahead of plan and reaffirmed the CHF 2.0 billion cumulative target for the year. The letter of the half-year number missed. The purpose of the test, is the program on pace, confirmed.
We grade it as the weaker of the two readings, a split, because that is what our published number said. But we tell you plainly that the program itself is delivering.
Test 4: Coffee and PetCare combined volume
Published bar: the two anchor categories showing combined RIG above 2% proves volume-led category leadership. Negative or zero volume in both kills the focused-portfolio thesis.
The number: PetCare delivered RIG of 1.8%, and Coffee delivered high-single-digit organic growth increasingly driven by volume rather than price. Combined, the two anchors clear 2%, and neither is anywhere near negative. Confirms.
This is the cleanest result in the grade, and it matters, because these two categories are the strategic core. If the focused portfolio works anywhere, it has to work here, and it did. One honest flag: Nestlé’s category table published Coffee as organic growth, not as a separate volume line, so the precise Coffee RIG figure is corroborated rather than printed. PetCare’s 1.8% is disclosed directly.
Test 5: Insider open-market buying
Published bar: a named insider buying in the open market confirms conviction. Continued net selling or no buys breaks it.
The result: we could not retrieve a specific, dated management transaction from Nestlé’s disclosure page this cycle. Per our own rule, we do not characterize a pattern we cannot document. Not graded. It stays open, to be checked directly against the management-transactions filings, and we would rather leave a test open than fill it with a guess.
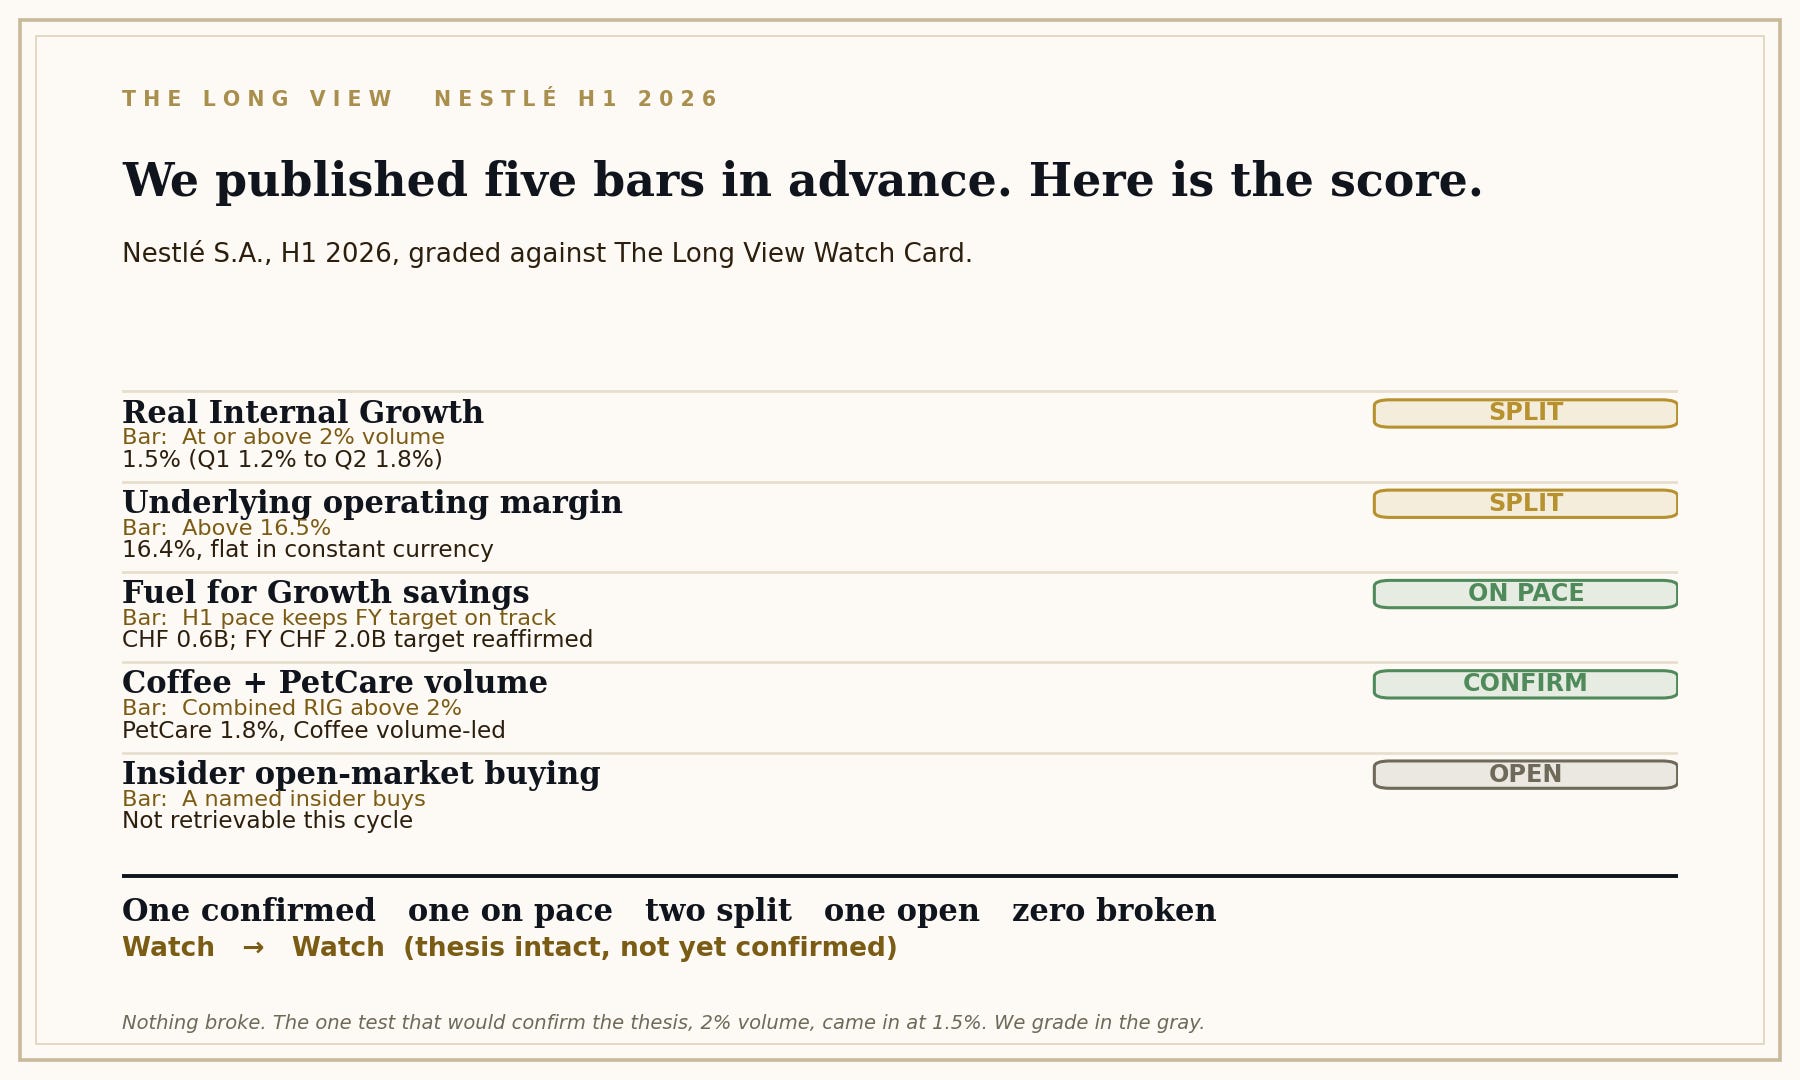
The tally: one confirmed, one on pace, two split, one open, zero broken
Sit with that shape, because it is the whole point of the exercise. Nothing broke. Nothing in this print disproved the turnaround. But the single test that would have confirmed the thesis, volume growth at 2%, came in at 1.5%. Nestlé did not fail. It did not yet pass either.
The number that would settle it
Everything routes back to one line. The bet is that volume returns, and volume returned, just not fast enough to call it. RIG of 1.5% is the number a turnaround posts on the way up, or the number a pricing story posts on the way down, and from a single half you cannot yet tell which. The Q2 reading of 1.8% leans toward the first. The full-year guidance of 3 to 4% organic growth assumes it. But assumption is not confirmation, and our bar asked for confirmation.
This is why a published bar matters most in the gray. A commentator free to move the line after the fact would call 1.5% a win, point at the improving quarters, and move on. We wrote 2% down in advance, in the open, and 1.5% is not 2%. The discipline is not in celebrating the confirms. It is in refusing to round up the ones that landed short.
The state change
Nestlé holds at Watch. It does not advance to In Review, because the test that governs the entire thesis did not clear its bar, and it does not fall to a break, because nothing in the print failed. A turnaround in its first full reporting period showed a real pulse and an unproven case at the same time.
Where it sits now
Nestlé reported net profit of CHF 3.5 billion for the half, down sharply year over year, with earnings per share of CHF 1.35, and it raised the low end of its organic growth guidance while trimming the margin outlook to broadly stable. Free cash flow guidance held above CHF 9 billion. This is not a company in trouble. It is a large, slow ship that has stopped drifting and started, barely, to turn. The price already assumes the turn completes. The half showed it beginning.
One thing we did not grade, and why
Our Watch Card pointed to the four-category simplification as the structural engine, the theory that a narrower portfolio grows faster than the old sprawling one. A single half cannot test that. It needs several reporting periods to show whether focus lifts the growth rate, and one print of 1.5% RIG is a data point, not a trend. We hold it as a research thread, not a graded test, and we will know more in three quarters than we can know today.
What we watch next, and when
Q3 organic growth, for whether RIG keeps climbing off the 1.8% second-quarter reading toward the 2% that confirms the volume story, or stalls, which would suggest the improvement was a rebound rather than a trend.
Then the management-transactions page, for any named insider purchase, which would close the one test we left open this cycle.
We named the assumption before the half, in the open. The Watch Card flagged the date. The Evidence tool pointed at the organic-growth bridge where the volume number lives, which is how we could grade it within minutes of the release. Nestlé stays in the Tracker at Watch, with the exact reason recorded: the volume test came in short of the line we published.
Run any company through the Stock Story Firewall, free, at firewall.readthelongview.com. Subscribers get the Evidence tool, the Watch Cards, and the full Research Tracker, including every test we have published and how each one scored.
Nestlé spent this half proving it can grow on volume again. It just did not prove it can do so fast enough to call the turnaround, and the honest grade is to say so rather than round it up.
Not investment advice. The subscriber decides.