

TL;DR: Between 1998 and 2025, across 8 million traders and 295 million trades, 74 to 89 percent of retail investors lost money. The single most consistent cause: they bought the story without testing the assumption underneath it. The Stock Story Firewall classified Mastercard as Clear for Deeper Research this week. This post shows exactly what that means — the hidden assumption, the evidence, and the two specific numbers to watch before Q2 2026 earnings in July.
74 to 89 percent of retail investors lose money.
Not in bad years. In every year. Across 27 years of data covering 8 million traders and 295 million trades.
The researchers who studied this found the same cause holding with clockwork consistency across every market condition: investors bought the story without ever asking the one question that determines whether the story holds.
What has to be true for this thesis to work?
That question — and the discipline to actually test the answer — is what separates the investors who consistently profit from everyone else. We built The Long View around it. This week the company is Mastercard.
The Story Being Sold
Mastercard is one of the cleanest investment stories in the market. A toll booth on every transaction. Zero credit risk — they process payments, they do not lend money. Revenue grows automatically as the world shifts from cash to digital. The margins confirm it. The earnings confirm it. Everything looks exactly the way you want it to look.
It is a story so clean that most investors stop there. The story sounds right. The numbers support it. Why dig further?
Because the story sounding right is exactly when the hidden assumption problem is most dangerous.
What the Stock Story Firewall Found
We ran Mastercard through the Stock Story Firewall. The tool does one thing: it finds the single belief underneath the investment story that has to be true for the thesis to work.
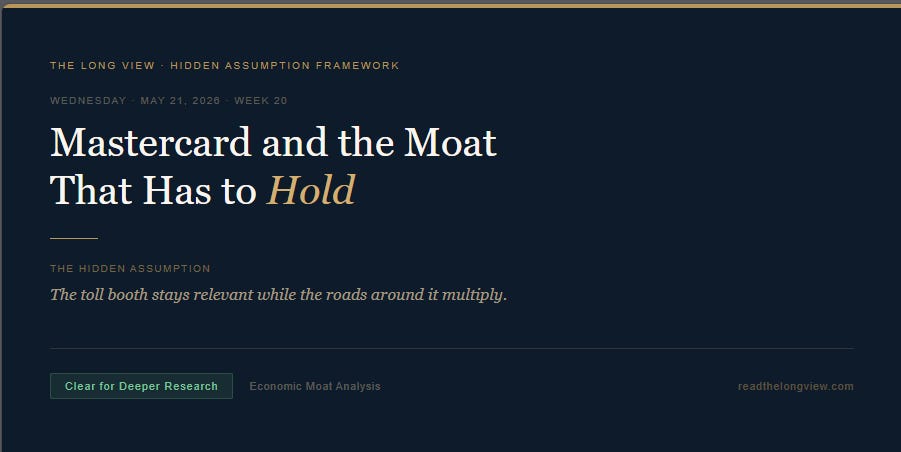
The hidden assumption for Mastercard:
The toll booth stays relevant while the roads around it multiply.
That is the belief. Every piece of evidence either supports it or weakens it.
Classification: Clear for Deeper Research.
Not a green light. A starting point. The hidden assumption has not been disproven. But it has not been confirmed either. And three specific things are happening right now that the standard Mastercard bull case does not fully account for.
What Is Actually Happening Right Now
One — Local payment rails are live and scaling.
India’s RuPay. Brazil’s PIX. Europe’s EPI initiative. These are not theoretical future threats. They are operating today, processing billions in transactions, and in several markets they were specifically designed by governments to reduce dependence on global card networks like Mastercard and Visa. The question is not whether they exist. It is how fast they scale and whether regulators push that scaling harder.
Two — Regulatory pressure on interchange is active across multiple jurisdictions.
Any material reduction in interchange rates does not just trim the margins. It changes the economics of the entire model. The toll booth can only charge what regulators allow it to charge.
Three — Value-added services are real, but the question is not answered.
Mastercard is building a services business — data analytics, cybersecurity, fraud intelligence — as a hedge against payment commoditization. That strategy is smart. Whether those services can carry the valuation if core payment margins compress is the question the bull case has not answered yet.
The Two Numbers That Answer the Question
Every hidden assumption has a tell. A specific number that moves before the headline metrics do. For Mastercard there are two.
Number one: Switched transaction growth rate versus overall digital payment market growth.
Switched transactions are the core of Mastercard’s network. If Mastercard’s switched volume is growing at 10 percent while the overall digital payment market is growing at 14 percent, the network is not strengthening. It is defending. Volume is going to alternative rails and Mastercard’s share of a growing market is quietly shrinking.
Find it: 10-K Item 7 and the quarterly earnings supplement on Mastercard’s investor relations page. Look for switched transaction growth rate year over year. Compare it to any market-level digital payment growth figure. The gap between those two numbers is the signal.
Number two: Cross-border volume as a percentage of total net revenue — tracked across consecutive quarters.
Cross-border carries significantly higher fees than domestic transactions. It is the highest-margin part of the business. If cross-border as a percentage of total net revenue is declining while domestic volume grows — partly driven by local payment schemes routing transactions domestically — the margin mix is shifting quietly while headline numbers still look clean.
The Evidence Intelligence Tool ran this analysis this week. Cross-border was approximately 17 percent of net revenue in Q3 2025, moving toward 18 percent in Q4 2025. Sequential expansion in the highest-margin corridor. Signal: Supporting — for now.
What the Evidence Says
The current evidence supports the hidden assumption with one significant qualifier.
Cross-border revenue concentration is strengthening. The toll booth is collecting higher fees on complex international flows where alternative rails do not yet have scale. That is the assumption holding.
The critical test — whether switched transaction growth is keeping pace with the overall digital payment market — requires verification from the Q1 2026 earnings supplement. That number tells you whether the network is growing or defending. Everything else is supporting evidence.
The moat is real. The question the evidence has not yet answered is whether it is growing or defending. Those are completely different investments at the same stock price.
What to Watch at Q2 2026 Earnings — Late July
Event: Q2 2026 earnings release — late July 2026.
Metric one: Switched transaction growth rate. Above 12 percent while digital payment market grows above 14 percent signals the network is holding position. Below 10 percent for two consecutive quarters signals the toll booth is losing traffic to alternative roads.
Metric two: Cross-border as percentage of net revenue. Three consecutive quarters of decline moves the classification from Clear for Deeper Research toward Watch.
Neither of those conditions exists today. That is why the classification is Clear for Deeper Research and not Watch. Both conditions are trackable. That is why the research does not stop at the story.
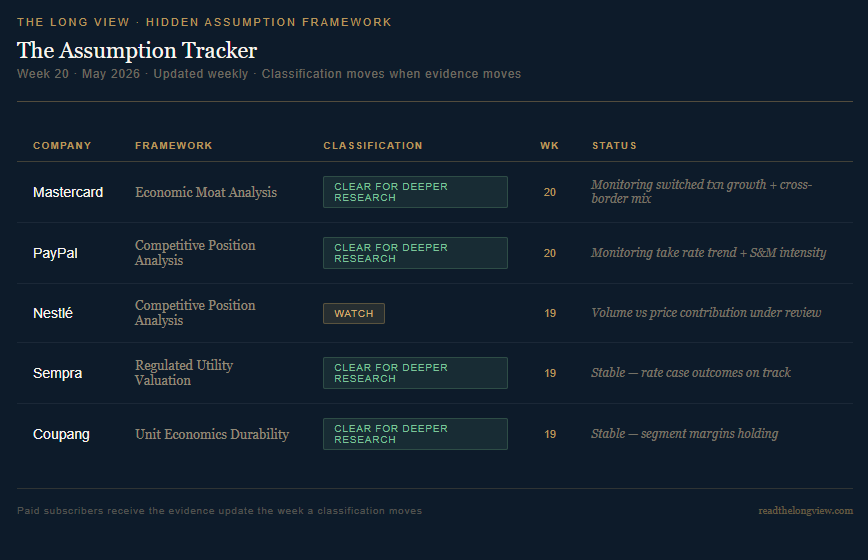
The Assumption Tracker
Companies The Long View has classified — updated weekly. Paid subscribers receive the evidence update the week a classification moves.
The Tools
Step 1 — The Stock Story Firewall
Run any company. Find the hidden assumption in two minutes. Free. No account required.
Step 2 — The Evidence Intelligence Tool
Paid subscribers bring the Firewall result here. The tool shows what the current documents say about whether the assumption is holding or cracking. Run it on any company you own or are researching.
Step 3 — The Curriculum
The curriculum teaches you to do what the tools do — permanently. Document Primers, Framework Application Guides, and the weekly evidence posts demonstrate the methodology on real companies every week.
FAQ
Why Clear for Deeper Research and not Watch on Mastercard?
Clear for Deeper Research means the hidden assumption has not been actively disproven. The alternative payment rails exist but are not yet at a scale that visibly changes the Mastercard economics today. Watch requires a more immediate unresolved condition. Clear means the thesis deserves deeper work. It does not mean the assumption is safe.
What is the single most important data point to check first?
Switched transaction growth rate versus overall digital payment market growth rate. If Mastercard grows slower than the market it claims to dominate, the network is defending not growing. Find it in 10-K Item 7 and the quarterly earnings supplement on the Mastercard investor relations page.
How often should I recheck the classification on a company I own?
Every time a major filing drops — 10-K annually, 10-Q quarterly — and any time a regulatory action occurs in a key market. The classification is not permanent. The hidden assumption either holds or it does not.
Is this a buy or sell recommendation on Mastercard?
No. The Stock Story Firewall does not give price targets or recommendations. It finds the hidden assumption and identifies whether the evidence supports it. What you do with that information is your decision.
Why does The Long View do this every week?
Because 74 to 89 percent of retail investors lose money and the cause is always the same. They bought the story without testing the assumption underneath it. AI made this worse. Every investor now has access to the most powerful research tool ever built and most of them are using it to generate confident, useless answers because they do not know what questions to ask. The Long View teaches the question. The tools find the answer. The curriculum builds the skill permanently.
Peter Lynch called it turning over rocks. This is the system that teaches you how.