

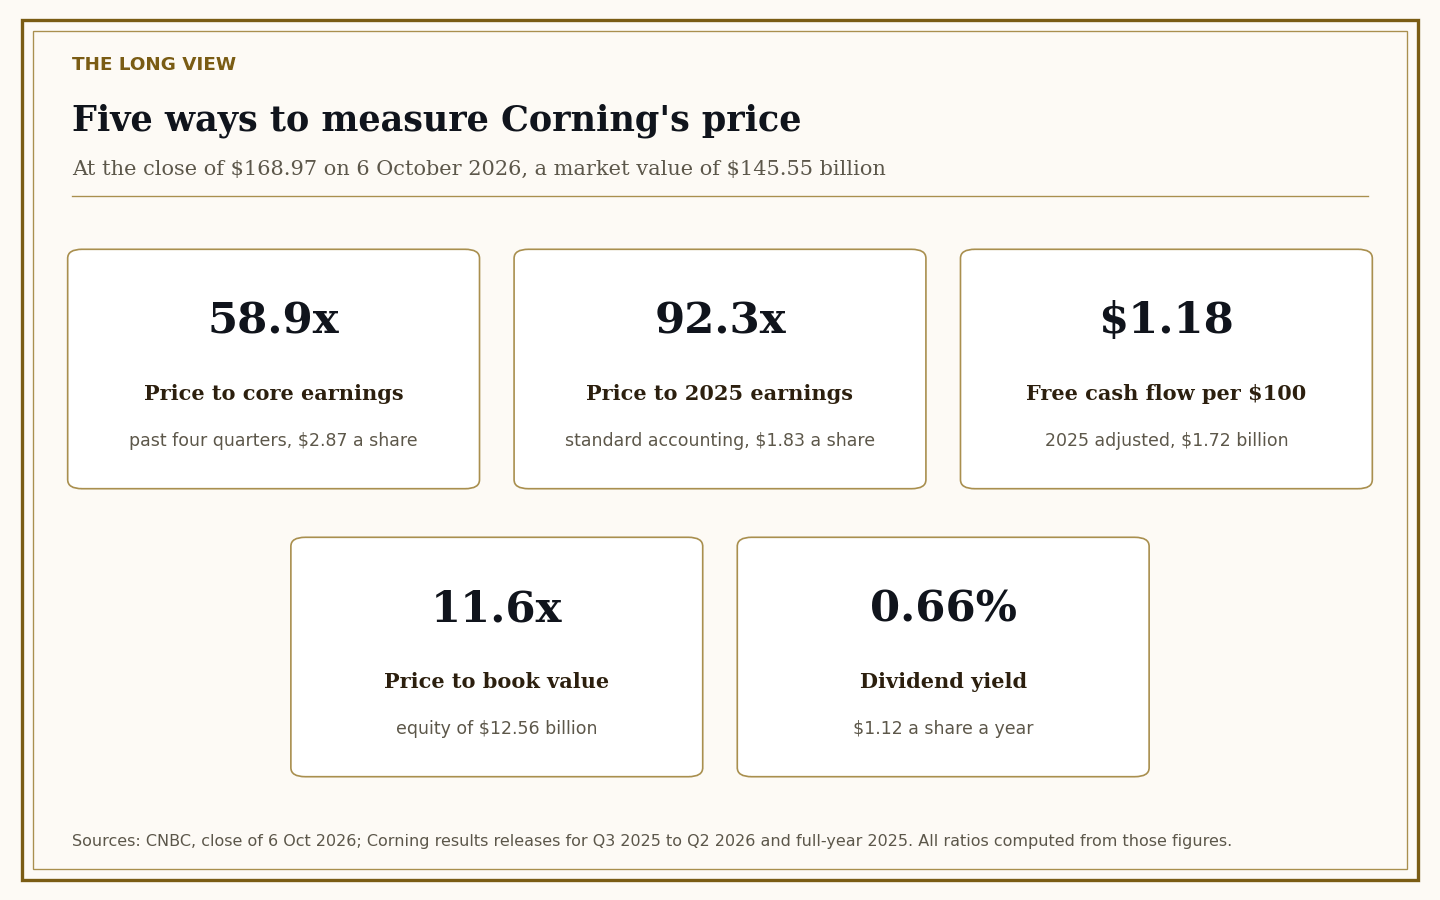
Corning Incorporated (NYSE: GLW) closed at $168.97 on 6 October 2026, according to CNBC. At that price the company is valued at $145.55 billion, or 58.9 times the $2.87 a share of core earnings it reported over its last four quarters. Whether that number is high matters less than a different question: what has to happen for that price to make sense, and do the filings show it happening?
Disclosure: the author holds no position in GLW.
Monday promised that this piece would set the price against what the business has delivered, and ask whether Corning carries a premium for being the one clean US door into AI fiber. Wednesday found its margin rising alongside its rivals’. Today is the arithmetic, and every step can be redone with the documents named.
The price, and where it comes from
A share price with no document behind it is just a number on a screen, so this one comes with its source. CNBC shows Corning closing at $168.97 on 6 October 2026, with 861.39 million shares outstanding, which puts its market value at $145.55 billion.
There is one price in a filing to set beside it. Corning’s Form 8-K dated 6 May 2026 gives Nvidia a warrant to buy up to 15 million Corning shares at $180.00 each. On 6 October the market price sat about 6.5 percent below that strike. Nvidia holds a right to buy Corning that is worth using only if the shares rise.
That says nothing about whether Corning is cheap. It does say the market is not currently paying more than the price Nvidia agreed in May.
Core earnings, and why the word matters
Corning reports two kinds of earnings. Its results releases give earnings under standard accounting, and a measure it calls core earnings, which leaves out items the company treats as outside its underlying performance. Each release reconciles the two.
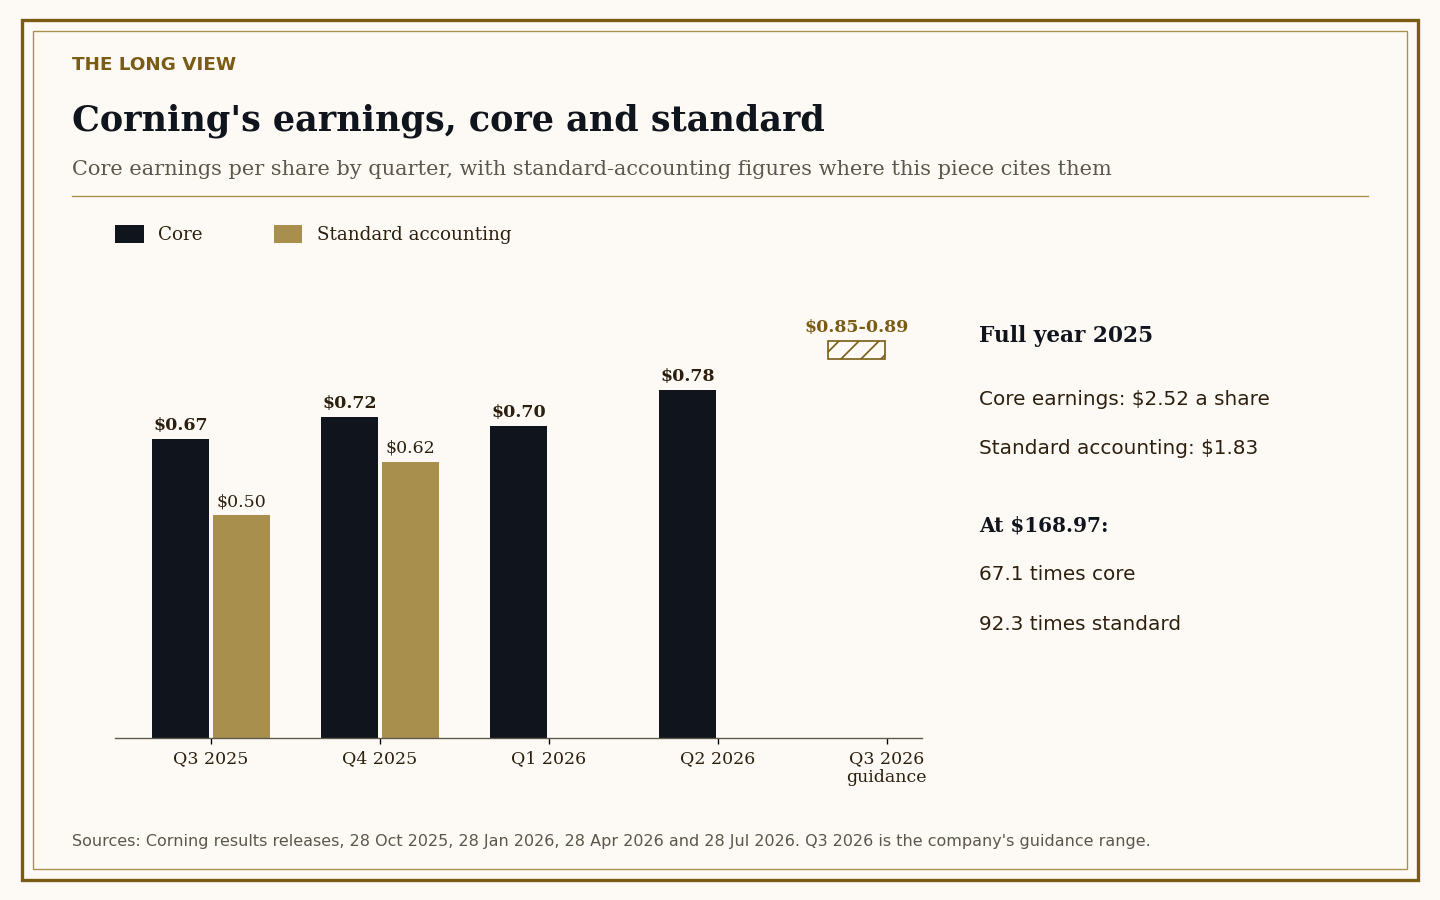
The gap is large. For 2025, Corning’s fourth-quarter results release reports core earnings of $2.52 a share and earnings under standard accounting of $1.83. In the third quarter of 2025 the pair was $0.67 and $0.50. In the fourth quarter it was $0.72 and $0.62.
The same share price gives two different answers. At $168.97, Corning trades at 67.1 times its 2025 core earnings, and at 92.3 times its 2025 earnings under standard accounting. Both figures are true.
The word core turns a stock at 92 times earnings into a stock at 67 times. Know which number you are paying for.
The rest of this piece uses core earnings, because that is the measure Corning’s own plan is built on. Read every multiple below as the lower of the two.
Three more ways to measure the price
Earnings are one lens. There are three others, each from Corning’s own figures.
Free cash flow is the cash left after the company pays for its plants and equipment. Corning’s fourth-quarter release reports adjusted free cash flow, its own measure, of $1.72 billion for 2025. Against a market value of $145.55 billion, that is $1.18 of free cash flow for every $100 of stock.
The second-quarter figure for 2026 looks much stronger, at $1.42 billion in one quarter. As Tuesday’s piece showed, $880 million of that quarter’s operating cash came from customer deposits and government incentives, so it is not a run rate.
Book value is what shareholders would have if the company’s assets were sold at the values on its balance sheet and its debts paid. Corning’s second-quarter release shows shareholders’ equity of $12.56 billion. The market values the company at 11.6 times that.
The dividend is the last lens, and the smallest. CNBC shows an annual dividend of $1.12 a share, a yield of 0.66 percent at the 6 October close. An investor buying Corning today is buying growth, not income.
What the price requires
A trailing multiple looks backward. The more useful question looks forward: what growth makes today’s price reasonable?
Corning’s own second-quarter release supplies both inputs. It guides third-quarter 2026 core earnings to between $0.85 and $0.89 a share. And it says the company expects to deliver sales growth of 19 percent a year from the fourth quarter of 2026 to the fourth quarter of 2030, with earnings growing faster than sales. Both are management forecasts, and this piece treats them as forecasts.
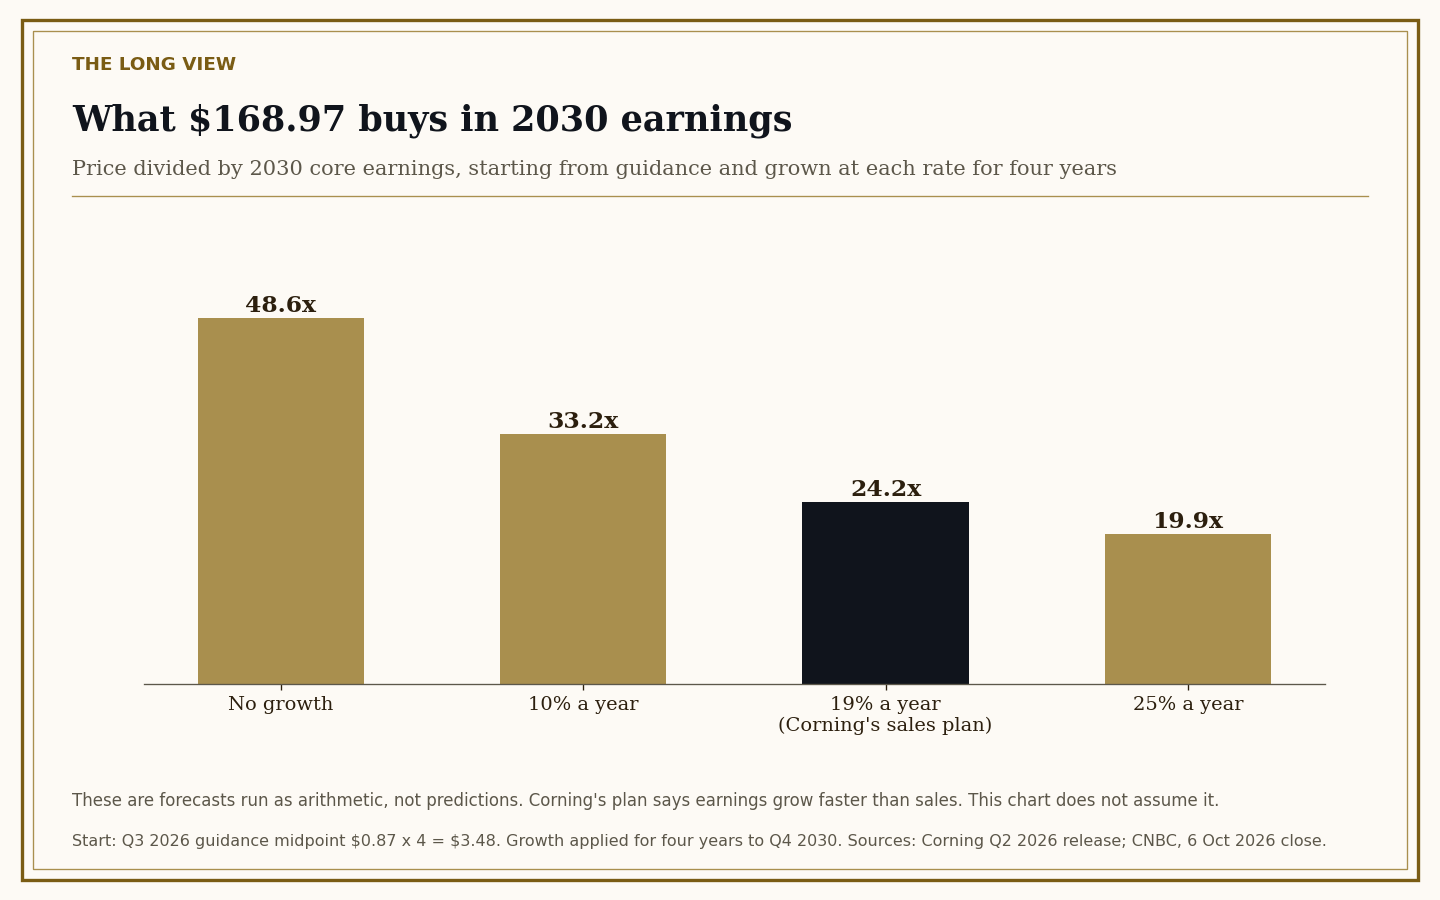
Take the midpoint of the guidance, $0.87, and multiply by four. That gives a starting rate of $3.48 a year. Grow it at 19 percent a year for four years, the period of Corning’s plan, and core earnings reach about $6.98 a share by the end of 2030.
At $168.97, that is 24.2 times 2030 earnings.
If Corning hits its own plan exactly, the price you pay today is still 24 times what it earns four years from now.
That is the sense in which the price assumes the plan works. The plan is not a stretch the price leaves room for. It is roughly what the price already counts on.
If growth comes in faster, or slower
The same arithmetic, run at other growth rates, shows how much depends on the plan.
At no growth from the $3.48 starting rate, $168.97 is 48.6 times earnings in 2030. At 10 percent a year it is 33.2 times. At Corning’s 19 percent it is 24.2 times. At 25 percent a year, faster than the plan, it is 19.9 times.
Corning’s plan says earnings will grow faster than sales, which would bring those multiples down. That is a forecast too, and the table does not count on it. If you believe earnings will outrun sales, run the same steps with a higher rate. One more input cuts the other way. Nvidia’s two warrants cover up to 18 million Corning shares, and any shares issued under them spread the same earnings across more of the company.
What Corning has delivered, and what history can tell us
Start with what Corning has delivered so far. Its fourth-quarter release reports core earnings up 29 percent in 2025, and says adjusted free cash flow nearly doubled between 2023 and 2025. Its second-quarter release reports core earnings up 30 percent in the quarter and Optical Communications net income up 77 percent.
The build is visible too. Corning has committed to lifting its American fiber capacity by more than half and its American connectivity capacity tenfold, while Prysmian intends to take its own US fiber capacity past double. On the demand side, Verizon’s agreement alone runs to over 80 million fiber miles between 2027 and 2032, counting every strand. One figure is missing. The Corning filings I read report fiber in dollars, not miles, so how much it has produced is NOT PROVEN.
History is how I check what I am looking at. I do not use it as a forecast. I use it to see whether today resembles an earlier period, and whether the signs that once warned investors are showing up again.
On demand, 2000 turns out to be a weak guide. Corning’s 2001 annual report blamed that slump on long-haul telecom carriers buying less. Today’s buyers are hyperscalers wiring data centers, and one of them paid $1.0 billion up front. Between them, Meta, Amazon, Alphabet and Microsoft expect to spend about $730 billion on capital projects this year, against roughly $115 billion spent by US telecom carriers in 2000, and Friday’s piece sets those figures out in full.
On supply, 2000 still carries a warning. Corning’s 2002 annual report named pricing pressure alongside the fall in volume. Corning and Prysmian are both adding US capacity now. That is the part of the comparison worth keeping.
The door premium, and why it cannot be measured yet
Monday asked about a premium for Corning’s position as the easiest US way into fiber. On today’s evidence, the answer is NOT PROVEN.
A premium is a comparison. It means Corning’s price is higher than a similar business would command without the scarcity. Showing it needs the other doors measured the same way: Amphenol, Lumentum and the rest, on the same earnings, cash flow and growth arithmetic. That is next week’s work, and it runs on exactly the method used here.
What today’s numbers can say is narrower. At 58.9 times trailing core earnings and 24.2 times its own 2030 plan, Corning is priced as a company expected to keep growing quickly for years. Whether some of that price is scarcity rather than growth cannot be separated from one company alone.
Margin of safety
A margin of safety is the gap between the price you pay and a conservative estimate of what a business is worth. It is what protects an investor when the forecast is wrong.
At today’s price, Corning’s margin of safety rests on its plan arriving on time. The plan does not have to be beaten for the price to hold up. It does have to be met. A slower year, a pause in data center building, or rivals’ new capacity arriving at once would each push the 2030 multiple up from 24.2, not down.
My reading of the numbers, and it is a reading, is that the price leaves little room for error.
The hidden assumption, priced
The hidden assumption this week is that Corning’s size, contracts and technology turn into AI fiber revenue at margins its competitors cannot match, at a price that has not already paid for all of it.
Monday found the size is real and the crown is unproven. Tuesday found the agreements are real, with one customer paying a $1.0 billion deposit. Wednesday found the margin is shared. Today’s arithmetic says the price has paid for most of the plan already. On the numbers in Corning’s own filings, the price sits above what its delivered earnings support and close to what its plan supports.
That is a classification, not advice. A buyer who expects Corning to beat its plan can see room here. A buyer who wants a margin of safety will find it thin.
Tomorrow
Tomorrow brings the week together: the scorecard on every test, what Google’s AI and ChatGPT got right and wrong, and the roads beyond Corning that an American investor can take, from Lumen’s network to Amphenol, Lumentum, Coherent and Dycom.
The question to carry until then: at 24 times its own 2030 plan, how much room for error would you want before paying for a fiber company, knowing what happened after 2000?
Not investment advice. The subscriber decides.