


The Long View: Cincinnati Financial, earnings preview.
Cincinnati Financial has raised its dividend for 65 straight years. Only a handful of American companies ever have, and the number tends to end the argument before it starts. Do not let it. A streak that long tells you what the company survived, not what pays the next raise.
First, know what kind of dividend stock this is
There are two kinds of dividend companies, judged differently. The compounder you buy for the machine underneath, the returns on capital that grow the payout fast, and you wait for the price to follow. The income stock you buy for the yield itself, a reliable check year after year, not a 10x. One question: is that check safe?
Cincinnati is the second kind. Nobody owns it expecting the next Nvidia. They own it for 65 years of rising dividends and the promise of a 66th. So the test is not “will this compound,” it is “is the income durable, and is the yield worth what I am paying.” Miss that distinction and even smart tools reach the wrong answer.
Dividend School, one of the sharper dividend voices on Substack, publishes a fast six-point checklist we like: understand the business, healthy margins, ROIC above 12 percent, a decade of growth, payout under 60 percent, yield versus history. Their principle is ours: buy the growth math, not the payout. Look at the engine, not the headline. Here is what happens when you run Cincinnati through it.
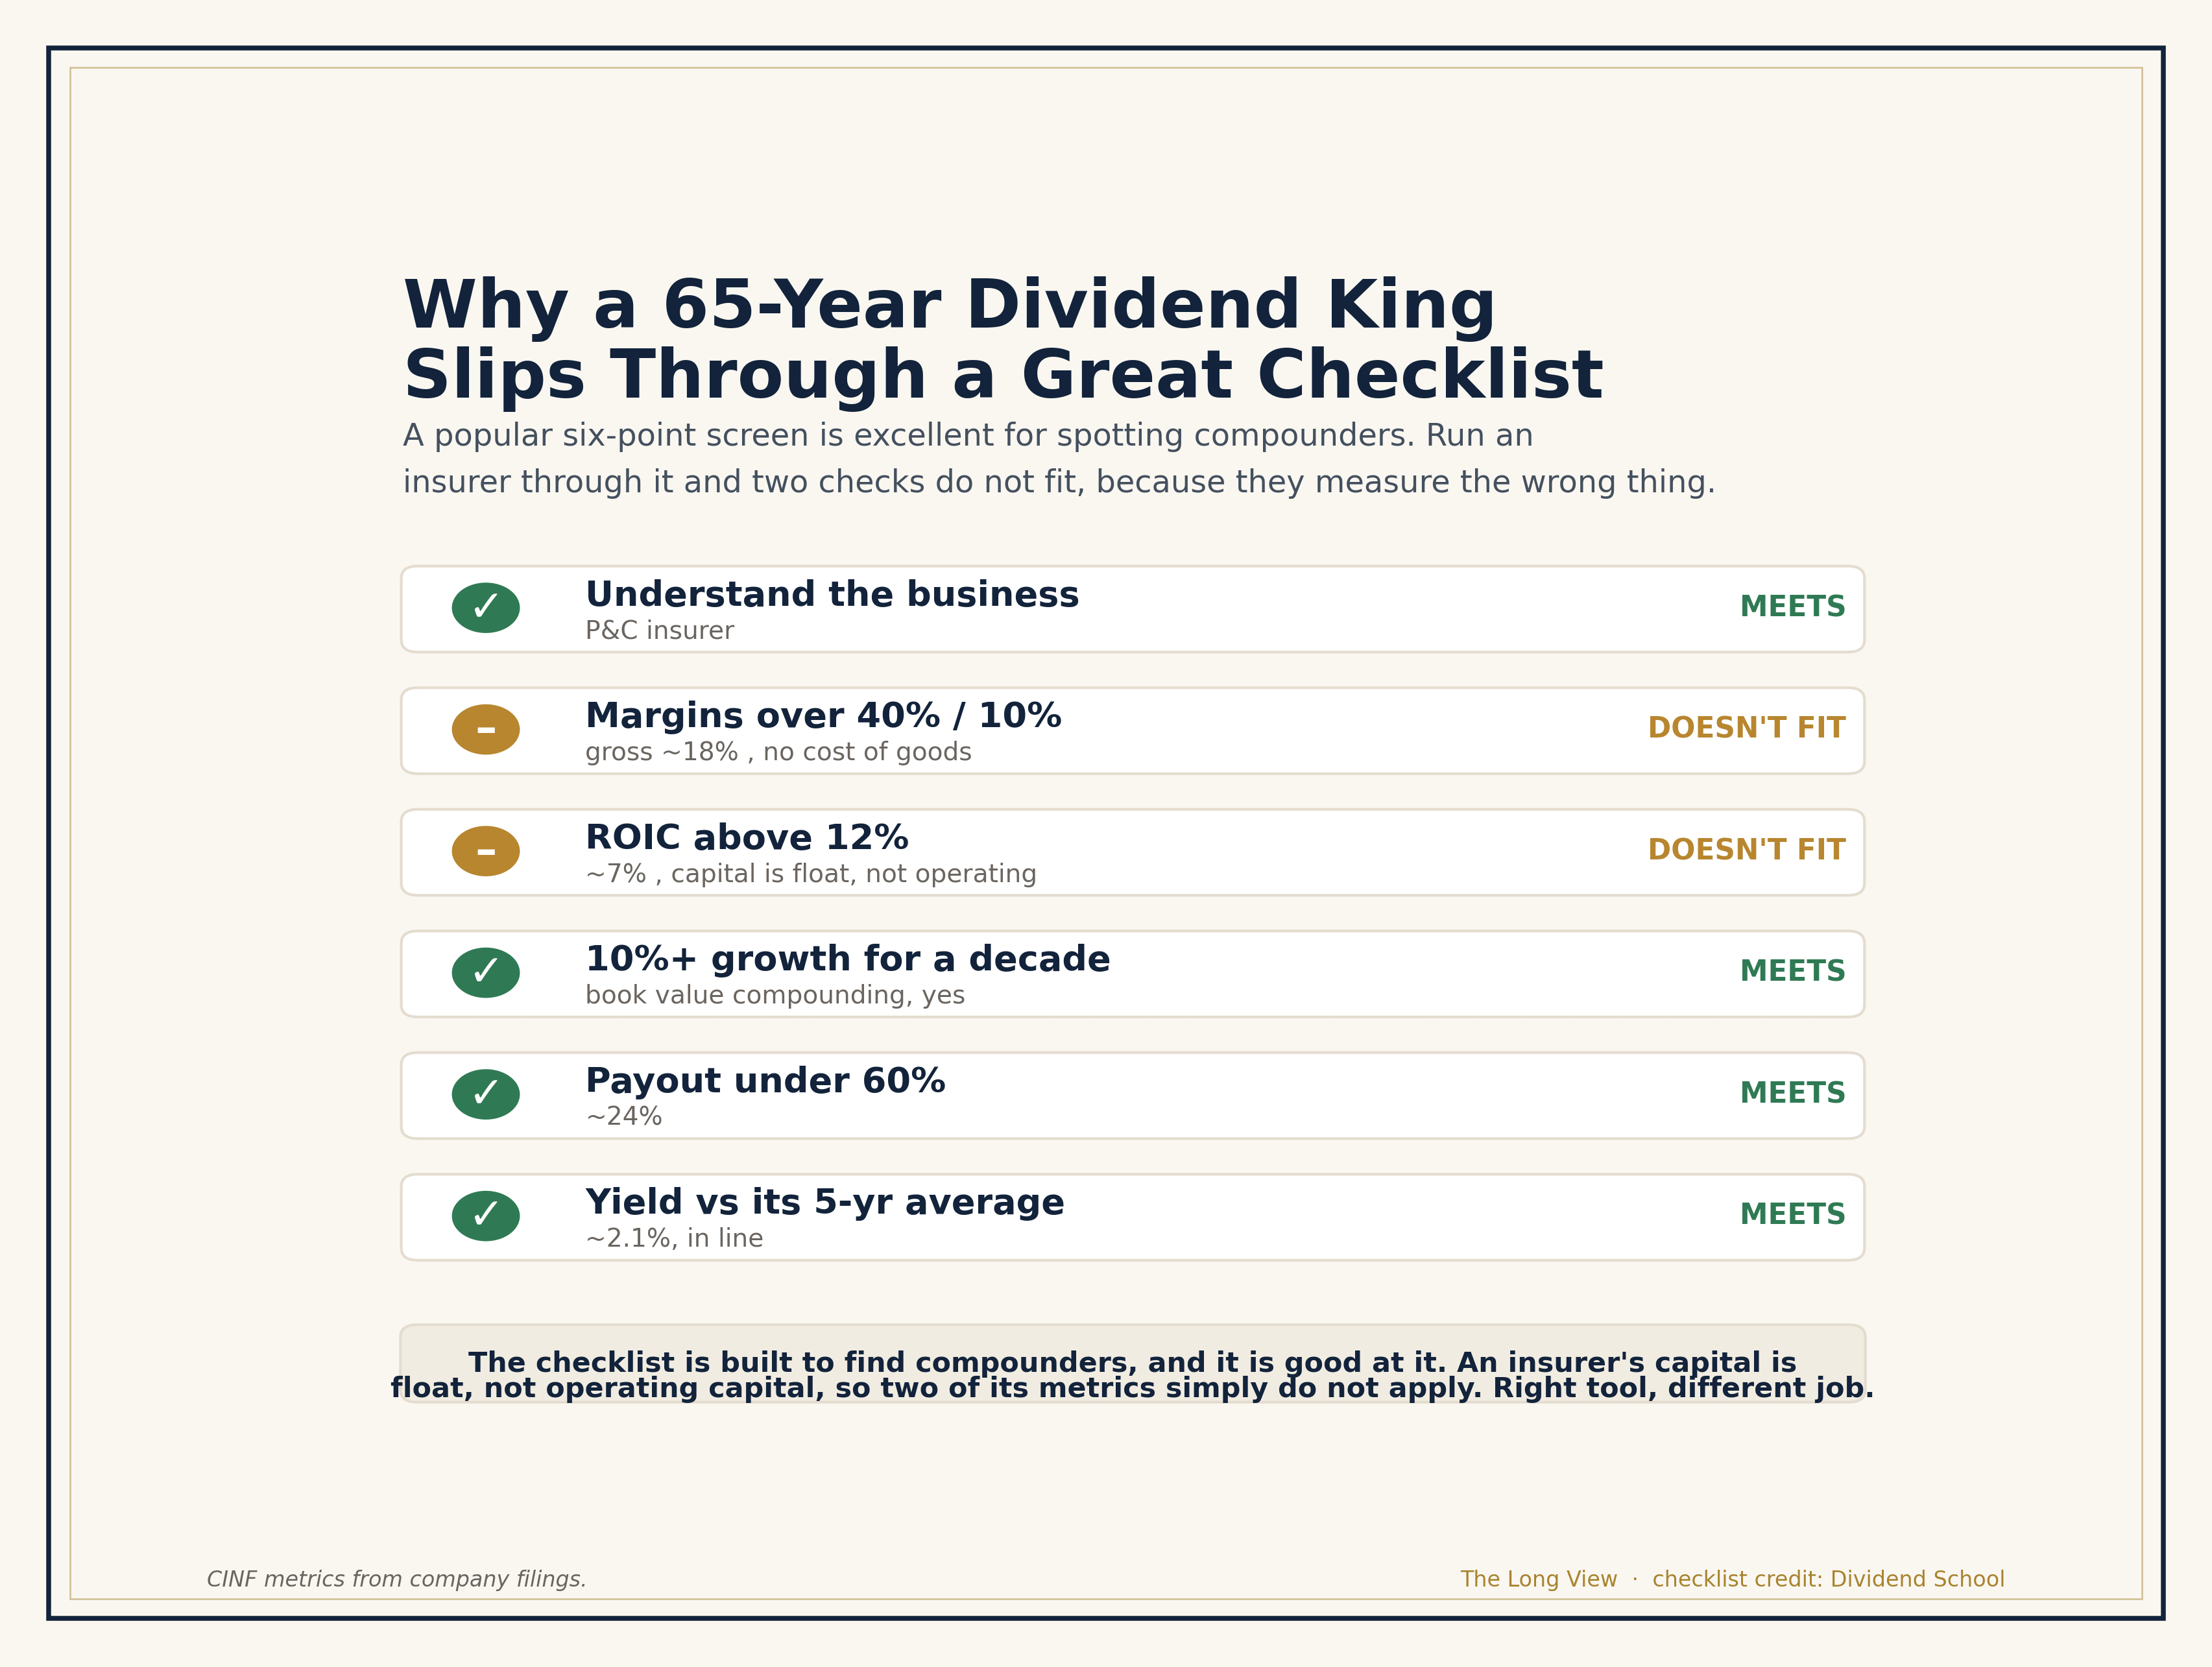
Why a 65-year dividend king slips through a great compounder checklist: two of the six metrics do not fit an insurer.
It flags twice. Gross margin near 18 percent, under the 40 percent line. ROIC around 7 percent, under the 12 percent bar. The rule is “fail one, move on,” and a checklist built for compounders would walk you past one of the most reliable dividend payers in American history.
That is not the checklist being wrong. It is pointed at the wrong kind of company. An insurer has no cost of goods, so “gross margin” barely applies, and its capital is float, premiums held until claims come due, not operating capital, so standard ROIC understates it. The tool is excellent for the compounders it screens. Cincinnati is an income stock, and income stocks need an income test, one number our Firewall points straight at.
The assumption underneath the streak
We ran Cincinnati through the Stock Story Firewall this week. It came back Clear for Deeper Research, the tool waving the company forward as worth real work. Here is the assumption it named, the belief the price requires to be true.
Cincinnati Financials’ independent agency distribution and consistent underwriting discipline will keep its combined ratio below peers through full insurance cycles, compounding book value and dividends reliably over time.
Read the operative words. Through full insurance cycles. Not one quiet quarter, but the storms and the bad years. The bet is that the underwriting is good enough to carry the dividend when nature stops cooperating.
The framework, and the one number it lives in
The Firewall prescribed Economic Moat Analysis, and for an insurer the moat has one scoreboard: the combined ratio, the share of premium dollars paid back out as claims and expenses. Below 100, the company made money on the insurance itself, before any investment income. Above 100, it leaned on its portfolio to cover the gap. A real moat holds the ratio below 100 in good years and bad; a weak one holds only when the weather is kind. Cincinnati’s target is 92 to 98. That band is the whole question.
The quarter that looked like a triumph
The first quarter of 2026 looked excellent. The combined ratio came in at 95.6 percent, inside the target band, improved 17.7 points from 113.3 percent a year earlier. Operating income swung to 330 million dollars from a 37 million dollar loss. On the headline, the moat looks pristine.
Now read the filing. Of that 17.7 point gain, 14.2 points came from one thing: lower catastrophe losses. The quarter looked better mostly because fewer storms hit, not because of pricing or risk selection. The headline ratio tells you as much about the sky as the underwriting.
Strip catastrophes out, though, and the underlying accident-year ratio was 87.5 percent, improved three points. That is the engine with the weather removed, and it got better. Two truths at once: the headline was flattered by calm skies, and the underwriting improved. The bet is which one the next quarter proves durable.
What the headline buries
The reported profit was not pure underwriting either. Net income took an 82 million dollar after-tax hit from falling equity values, which pulled the Value Creation Ratio, the company’s own north-star metric, down to 0.2 percent against a 10 to 13 percent target. That points to a second durability question beyond the weather, how much of the result is insurance, and how much is a bet on a stock portfolio? We take that question up in a companion piece.
The fair case for the streak
The bull has the record. Sixty-five years of increases is six decades of underwriting good enough to keep raising the payout. The 87.5 percent underlying ratio says the engine is improving. The agency model, selling through independent agents who place business with insurers they trust, is a durable relationship moat. Premiums grew 7 percent, investment income 14, book value per share 16. Weather aside, the moat is working.
All of it was equally true right before the years the combined ratio blew past 100. The test is not whether the moat exists. It is whether it holds when the catastrophes come back, because they always come back.
The test, written before the number
Cincinnati reports second-quarter results Monday, July 27, after the close. We set the bar now, before the print, where we cannot move it.
Confirms: the combined ratio holds in the 92 to 98 band on a normal catastrophe quarter, and the underlying ratio before catastrophes stays near or below 87.5 percent. Discipline, not weather, carrying the load.
Breaks: the ratio pushes toward or above 100 once catastrophe losses normalize, revealing the first-quarter calm was doing the work.
Ambiguous: the ratio holds, but only because catastrophes stayed light again, leaving the question open another quarter.
We do not predict which way it breaks. We name, in advance, what would tell us the streak is built on underwriting, not luck.
One more thread, worth its own piece
Working through Cincinnati raised a question the earnings test does not answer. This is a famously steady company, and yet its share price keeps getting cheap, handing patient buyers a lower entry every few years. For a business that has raised its dividend 65 years running, that is a strange and useful pattern, and once we noticed it we wanted to understand why it keeps happening.
The answer turned out to be interesting enough to pull into its own article, a look at why a dividend king like this one goes on sale again and again, and what that means if you own it for the income rather than the price. You can read that companion piece alongside this one.
The takeaway to keep
Here is the lens that outlasts this company. Before you judge a dividend stock, know which kind it is. A compounder you test on the engine, returns on capital and growth. An income stock you test on whether the payout survives a bad year. Use the wrong test and you wave past a great income stock or overpay for a weak one. Find the number that measures the right thing, the combined ratio for an insurer, and check it when conditions turn hostile, not kind. The dividend is the output. The discipline is the input. Only one tells you about next year.
Cincinnati Financial reports Monday, July 27, after the close. We grade this exact test the next morning and roll it into the Tracker.
The author holds shares of CINF. This is a disclosure, not a recommendation.
Not investment advice. The subscriber decides.