


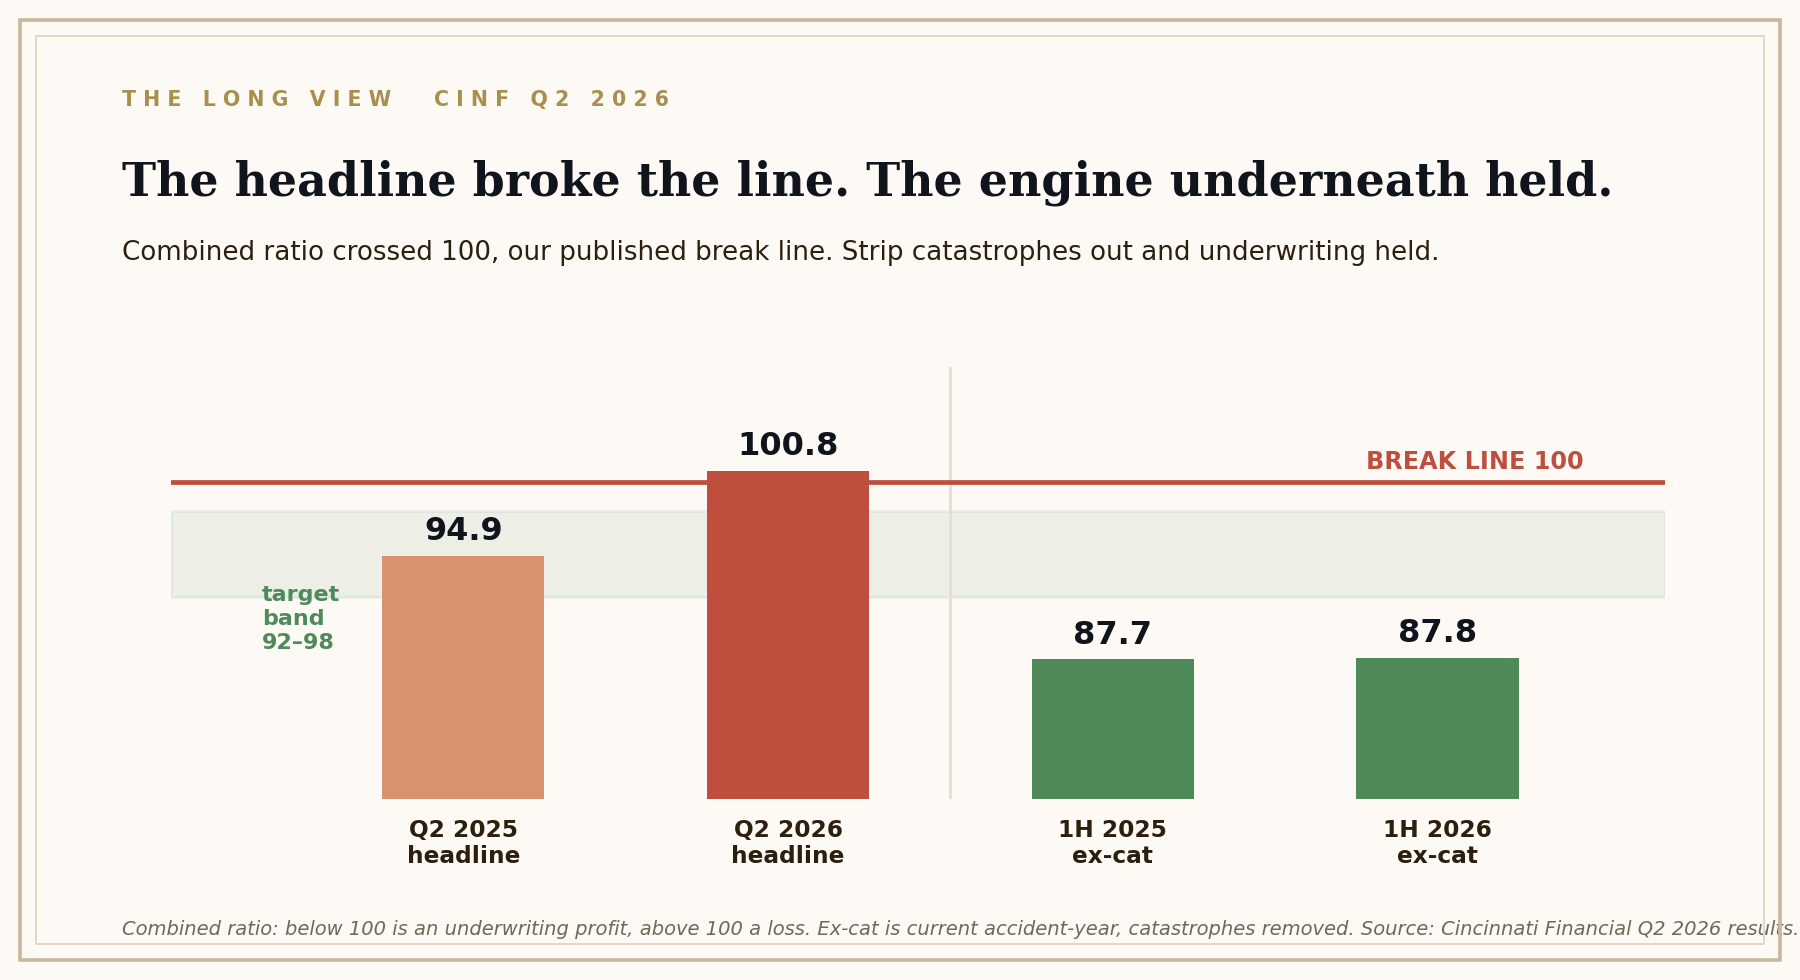
The combined ratio crossed 100, which was our published break line. This is the first broken test in the series, and we are not going to soften it.
The Long View · Thursday, 30 July 2026 · Cincinnati Financial (CINF), Q2 2026 earnings grade
Disclosure: the author holds shares of Cincinnati Financial. This is a grade against a published bar, not a recommendation.
Before Cincinnati Financial reported, we published a Watch Card with five bars and classified it Clear for Deeper Research. This is the grade against those bars. One of them broke, and it is the one that matters most, so this is also the first time we get to show you what we do when the number goes against us: we call it.
We did not have to remember this print was coming
The Watch Card carried the date. Cincinnati surfaced with all five tests pending and Q2 results due July 27. The calendar lives in the tool, not in your head.
What the tool told us, and what it warned us
The Firewall classified Cincinnati Clear for Deeper Research, framework Economic Moat Analysis, and named the assumption plainly: that Cincinnati’s independent agency model and underwriting discipline will keep its combined ratio below peers through full insurance cycles, compounding book value and dividends reliably over time.
Here is the part that matters today. In the same report, under evidence that would weaken the story, we wrote this down: the Q1 improvement included a favorable $233 million from lower catastrophe losses, meaning much of the year-over-year gain was weather-driven, not structural, and would reverse in a bad catastrophe year. We did not phrase it as a worry. We phrased it as the thing to watch for. Then we watched.
The bet, and the trap inside it
An insurer has one number that tells you whether the insurance itself makes money: the combined ratio, the share of every premium dollar paid back out in claims and expenses. Below 100, underwriting is profitable. Above 100, the company lost money on the insurance and is leaning on its investment portfolio to cover the gap. Cincinnati’s target band is 92 to 98.
The trap in a 65-year dividend record is that it makes you stop asking whether the insurance is still profitable, because the streak feels like proof. It is not. It is history. The combined ratio is the live test, and this quarter it delivered a verdict.
Test 1: Property Casualty Combined Ratio
Published bar: the combined ratio stays within the 92 to 98 target band confirms. A breach above 100, signaling an underwriting loss, breaks it.
The number: 100.8%. Break.
Up 5.9 points from 94.9% a year ago. Catastrophe losses ran 14.4 points of the loss ratio, with Ohio alone near four times its five-year second-quarter average, and Commercial lines widening to 104.1%. The company lost money on underwriting this quarter, by the exact mechanism we flagged: weather.
We published 100 as the break line. The number is 100.8. We do not get to round that down because we like the company, and one of us owns it. It broke.
The number underneath the number
Here is what keeps a broken test from being a broken thesis, and it is the most important paragraph in this grade. Strip catastrophes out, and the current accident-year combined ratio for the first half was 87.8%, against 87.7% a year earlier. The underwriting engine did not deteriorate. It held, almost to the decimal. What broke was not the discipline. It was the weather, landing on top of the discipline.
That distinction is why we grade against a published bar, not a headline. The bar broke, and we report that first. But the diagnostic underneath tells you the break was catastrophe-driven, not a crack in the moat, the precise reversal we flagged in May. The story did not fail. The number we said would break, broke, for the reason we said it would.
Test 2: Net Written Premium Growth vs Industry
Published bar: net written premium growth above the A.M. Best industry projection of roughly 4% confirms the agency channel is winning share. Growth at or below the industry rate for two consecutive quarters breaks it.
The result: consolidated property-casualty net written premiums grew 3%, below the industry mark. Split, and a clock started. Management framed the slower growth as deliberate, policy-by-policy pricing discipline in a softening market rather than chasing volume, which is exactly what a disciplined underwriter should do when prices soften. But our bar was specific: at or below industry for two consecutive quarters is the break, and this is one. Q3 decides whether deliberate restraint becomes a trend we have to mark against the moat.
Test 3: Book Value Per Share
Published bar: book value per share growing year over year confirms value compounding. A decline breaks it.
The number: $108.64, a record high, up 6.1% since year-end. Confirms. The clean one. Even in a quarter with an underwriting loss, book value hit an all-time high, carried by an $882 million after-tax gain in the equity portfolio. Which sets up the one genuine worry in the report, below.
Test 4: Value Creation Ratio
Published bar: the value creation ratio at or above its 10% annual target confirms the compounding thesis. Below 5% for two or more periods without a catastrophe explanation breaks it.
The number: 7.9% for the quarter, 8.0% for the half, against 4.6% a year ago. Split. Below the 10% target that would confirm, well clear of the 5% break line, and nearly double last year’s pace. Moving the right way without yet arriving, with an explicit catastrophe explanation, so nowhere near a break.
Test 5: Insider open-market buying
Published bar: a named insider buying in the open market confirms conviction. Continued net selling or no buys breaks it.
The result: no named insider open-market purchase appeared, only routine compensation vesting. The company repurchased 1.3 million shares at about $161.93, but a corporate buyback is not the test, which asks about a named individual buying with their own money. Not graded, stays open, to be verified against the Form 4 record.
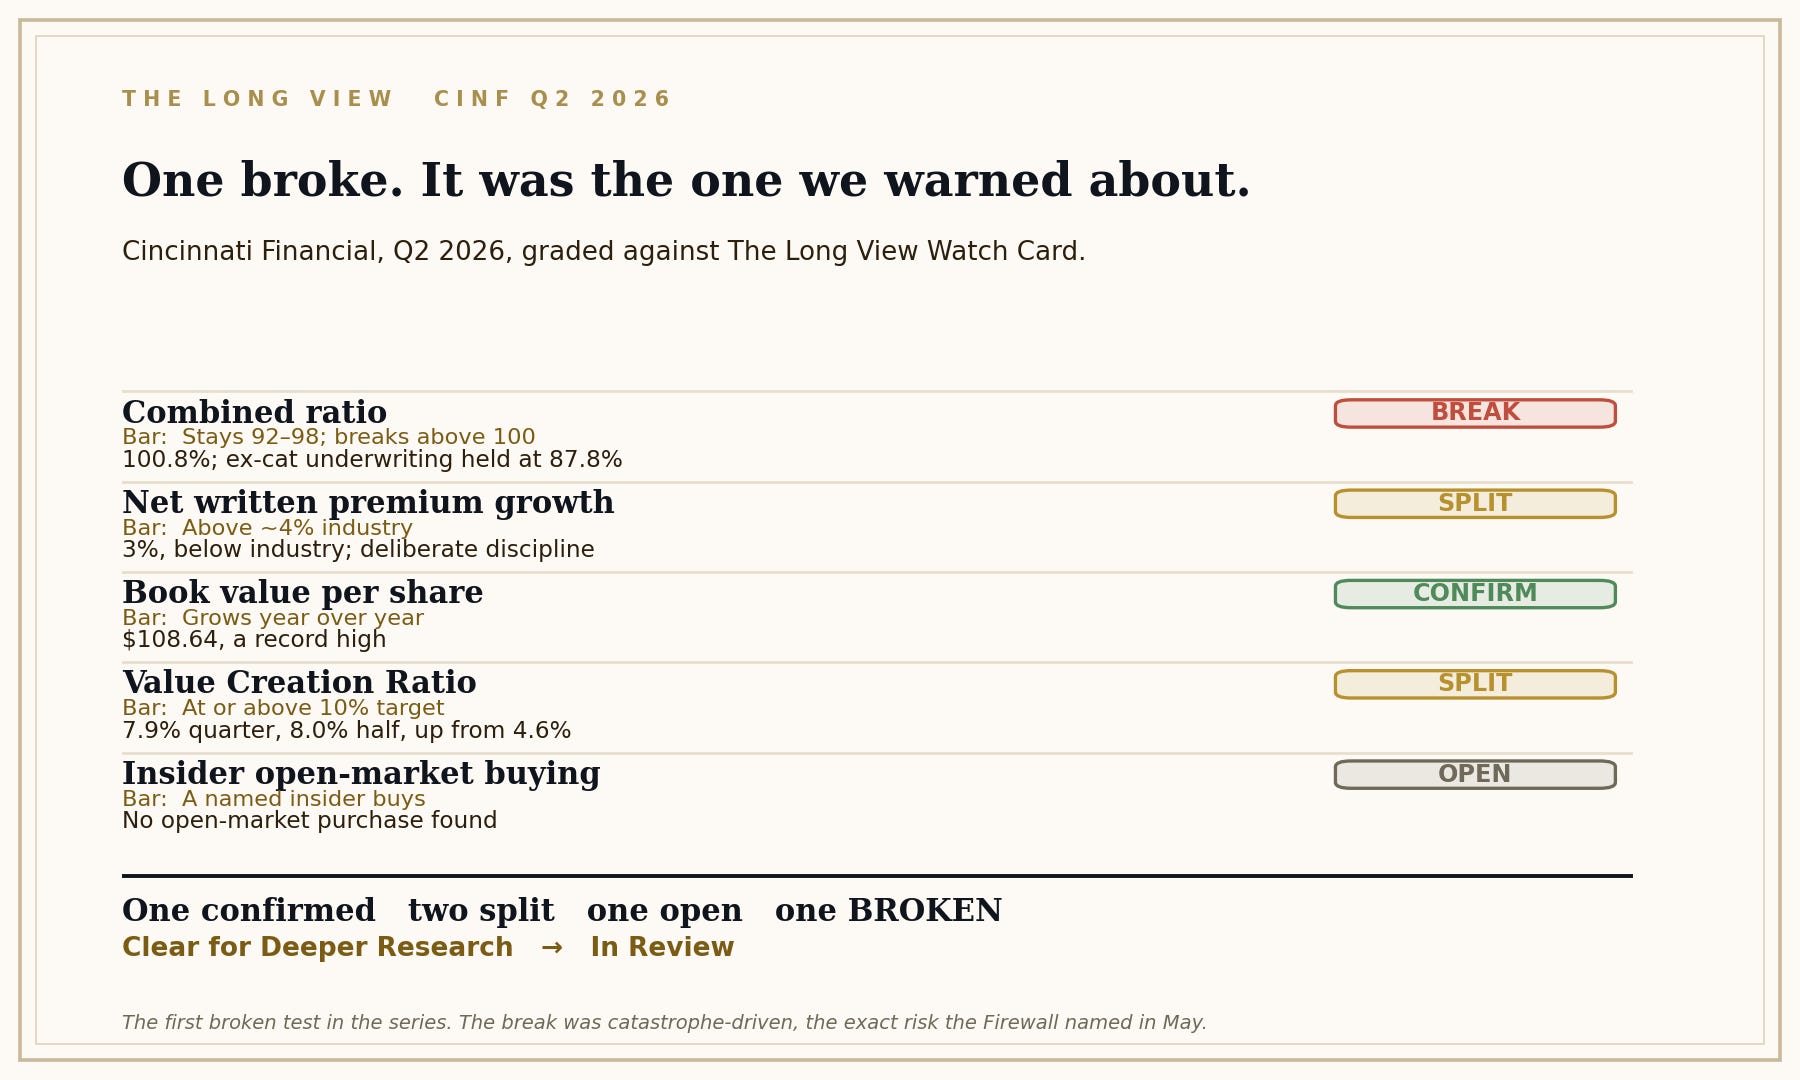
The tally: one confirmed, two split, one open, and one broken
This is the first grade in the series with a broken test, so read the shape carefully. Book value confirmed and hit a record. Two tests split, both improving but not yet clearing their bars. One stays open. And the headline test, the combined ratio, broke, crossing the 100 line we published, on catastrophe losses we told you in May to watch for.
The state change
Cincinnati steps down from Clear for Deeper Research to In Review. A broken headline test requires it. But it does not fall to a reject, and the reason is the 87.8% number: the underwriting engine held, the break was weather, and the risk that materialized is one we had already named and priced into how we read the company. This is a downgrade with its eyes open, not an alarm.
Where it sits now, and the one real worry
Net income was nearly $1.3 billion, which sounds like a triumph and mostly is not the insurance. It included an $882 million after-tax gain from the rise in Cincinnati’s equity portfolio. Non-GAAP operating income, which strips that out, fell to $224 million from $311 million a year ago. That is the honest picture: the insurance had a weak, catastrophe-hit quarter, and the stock market bailed out the headline.
That is the real concern, and it was on our published weakening list: Cincinnati’s equity portfolio is unusually large for an insurer, so book value and earnings swing with the stock market more than most peers. In a quarter where underwriting lost money and equities soared, book value hit a record. Fine on the way up. The same lever in reverse on the way down, and the question our third Firewall query asked directly.
One thing we did not grade, and why
Our Firewall flagged persistent reserve development as a break condition to watch, the risk that prior-year loss estimates prove too optimistic. The release does not give us clean quarter-level reserve development detail, and we will not infer it. It stays a research item for the 10-Q, alongside the equity-concentration percentage the third question asked for. We note it so the record shows what we settled and what we did not.
What we watch next, and when
Q3, for two things. Whether the combined ratio returns inside the target band once catastrophe losses normalize, which would confirm the break was weather and not a crack. And whether net written premium growth stays below industry a second consecutive quarter, which is the specific trigger our second bar named.
Then the 10-Q, for reserve development and the equity-portfolio concentration, the two items this release left open.
We named the assumption in May, and we named the risk that would break it in the same report. The Watch Card flagged the date. The Evidence tool pointed at the combined-ratio line, which is how we could grade the break the morning it landed. Cincinnati moves in the Tracker to In Review, with the reason recorded: the combined ratio crossed the line we published, on the catastrophe reversal we told you to watch for.
Run any company through the Stock Story Firewall, free, at firewall.readthelongview.com. Subscribers get the Evidence tool, the Watch Cards, and the full Research Tracker, including every test we have published and how each one scored, the breaks as well as the confirms.
We would rather show you a broken test we called in advance than a clean scorecard we massaged after the fact. Cincinnati broke the bar we published. It broke the one we warned about. And the discipline underneath the weather is still, for now, intact.
Not investment advice. The subscriber decides.